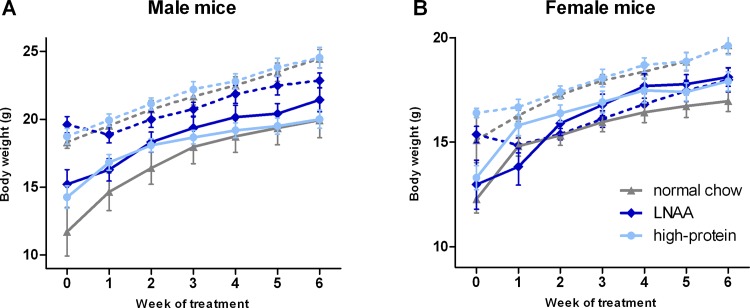
Fig 2. Body weights during the experiment.
Mean body weights for A) male and B) female WT (dashed lines) and PKU (solid lines) mice on different diets. Numbers of mice on normal chow, LNAA supplemented diet, and high-protein diet were n = 14, n = 14, and n = 14 for WT mice respectively, while being n = 15, n = 14, and n = 15 for PKU mice. Error bars represent SEM.

