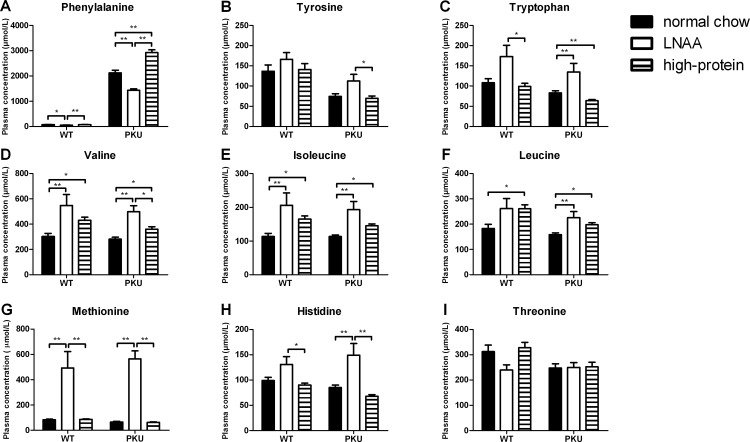
Fig 3. Plasma LNAA concentrations.
Plasma concentrations of A) phenylalanine, B) tyrosine, C) tryptophan, D) valine, E) isoleucine, F) leucine, G) methionine, H) histidine, and I) threonine in WT and PKU mice after six weeks of receiving different diets. Numbers of mice on normal chow, LNAA supplemented diet, and high-protein diet were n = 14, n = 12, and n = 14 for WT mice respectively, while being n = 14, n = 12, and n = 15 for PKU mice. Untransformed data are expressed as mean ± SEM. * p<0.05; ** p<0.01; § p<0.05 and §§ p<0.01 compared to WT mice on normal chow.

