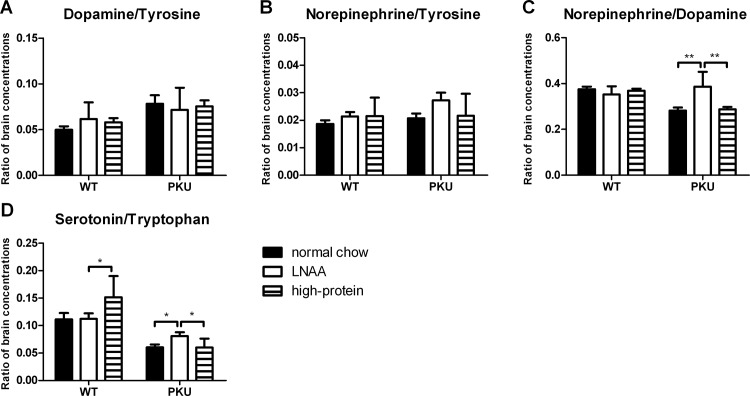
Fig 7. Ratios of brain monoaminergic neurotransmitters to precursors.
Ratios of brain A) dopamine/tyrosine, B) norepinephrine/tyrosine, C) norepinephrine/dopamine, and D) serotonin/tryptophan concentrations in WT and PKU mice after six weeks of receiving different dietary treatments. Numbers of mice on normal chow, LNAA supplemented diet, and high-protein diet were n = 13, n = 12, and n = 14 for WT mice respectively, while being n = 14, n = 12, and n = 14 for PKU mice. Untransformed data are expressed as mean ± SEM. *p<0.05; **p<0.01; and § p<0.05; §§ p<0.01 compared to WT mice on normal chow.

