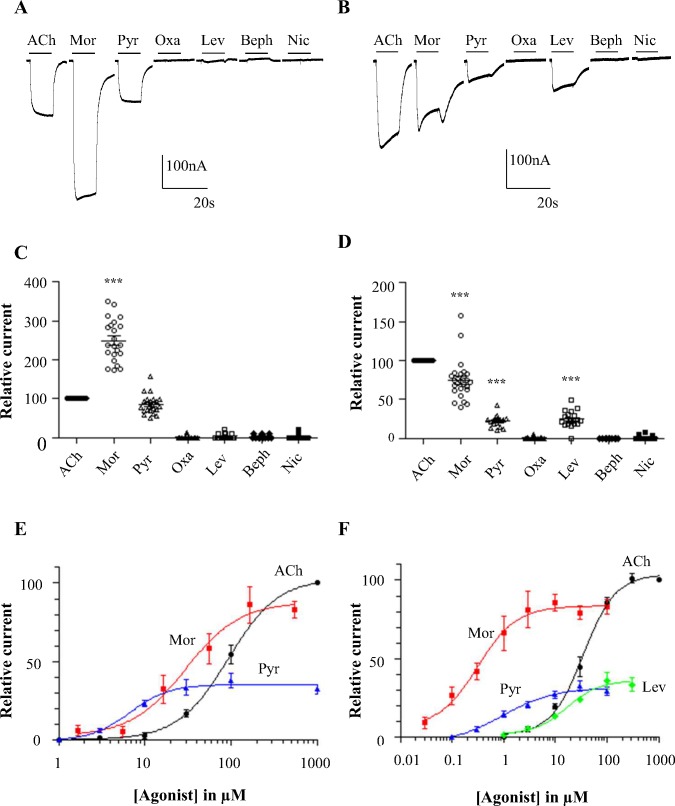
Fig 7. Pharmacological profiles of Hco-26/27 and Peq-26/27.
(A and B) Representative recording traces from a single oocyte expressing Hco-26/27 (A) or Peq-26/27 (B) challenged with 100 μM ACh and 100 μM of different anthelmintic compounds (morantel (Mor), pyrantel (Pyr), oxantel (Oxa), levamisole (Lev), bephenium (Beph) and nicotine (Nic)). The bars indicate the time period of the agonist application. (C and D) Scatter plot (mean ± SEM) of normalized currents elicited by 100 μM of anthelmintic compounds on Hco-26/27 (C) or Peq-26/27 (D). Currents have been normalized to and compared with 100 μM ACh currents. Paired Student’s t-test, ***p<0.001. (E) Dose-response relationships of Hco-26/27 for the agonists ACh (black circle, n = 6), Mor (red squares, n = 8) and Pyr (blue triangles, n = 6). Responses are all normalized to the response to 1 mM acetylcholine. EC50 are 80.1±1.1 μM, 29.0±1.3 μM and 6.8±1.3 μM for ACh, Mor and Pyr respectively. (F) Dose-response relationships of Peq-26/27 for the agonists ACh (black circle, n = 7), Mor (red squares, n = 9), Pyr (blue triangles, n = 10) and Lev (green lozenges, n = 6). Responses are all normalized to the response to 1 mM acetylcholine. EC50 are 34.9±1.1 μM; 0.32±0.26 μM; 0.98±0.26 μM and 16.7±1.3 μM for ACh, Mor, Pyr and Lev respectively.

