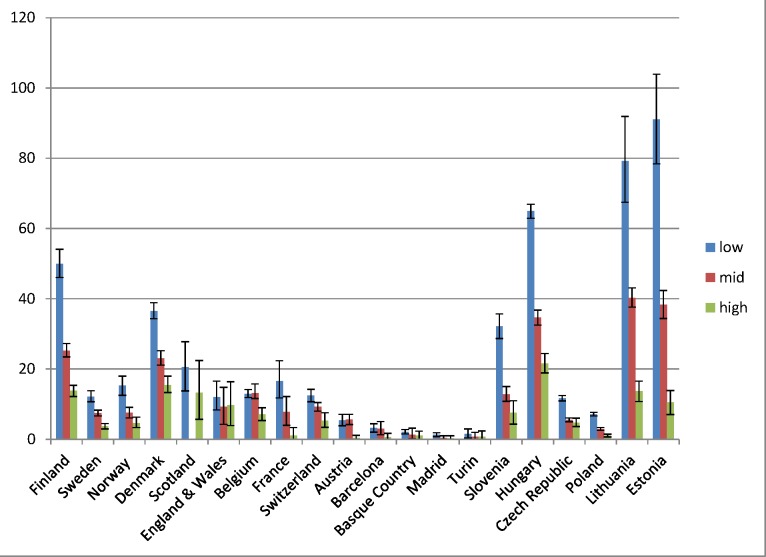
Fig 2. Latest observed mortality from alcohol-related causes among women aged 35–79 y, by population and level of education.
The y-axis shows alcohol-related mortality, with 95% CIs, in deaths per 100,000 person-years. Among Scottish women in the middle education group, the number of deaths was smaller than ten, and because of confidentiality regulations, data could not be supplied for this group.

