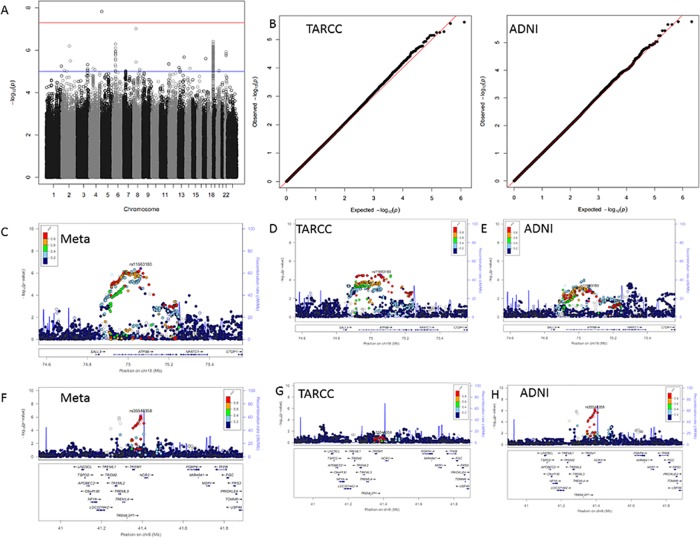
Fig 3. MCP1 results.
Panel A; GWAS Manhattan plot for meta-analysis of MCP1. Panel B; QQ plots for the association results for TARCC (left) and ADNI (right). Panel C; LocusZoom plot for the chromosome 18 signal from the meta-analysis. Panels D and E; LocusZoom plots for the chromosome 18 signal in TARCC and ADNI, respectively. Panel F; LocusZoom plot for the chromosome 6 signal from the meta-analysis. Panels G and H; LocusZoom plots for the chromosome 6 signal in TARCC and ADNI, respectively.

