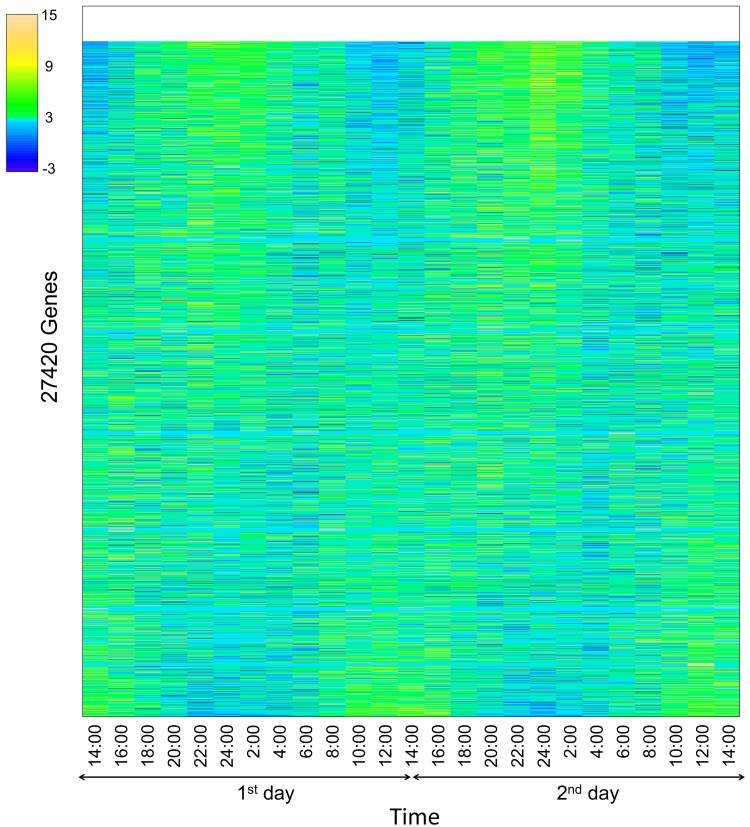
Fig 2. Heatmap of all expressed genes.
Gene expression was calculated using log-transformed RPKM values. Gene expression data were rearranged according to artificial data. The color palette was that of the topo.colors package of R software and shows data in 12 steps. Correlation coefficients are listed in order of gene (high, A). Genes with log values of ≤0.1 were used as blanks (1090 genes).

