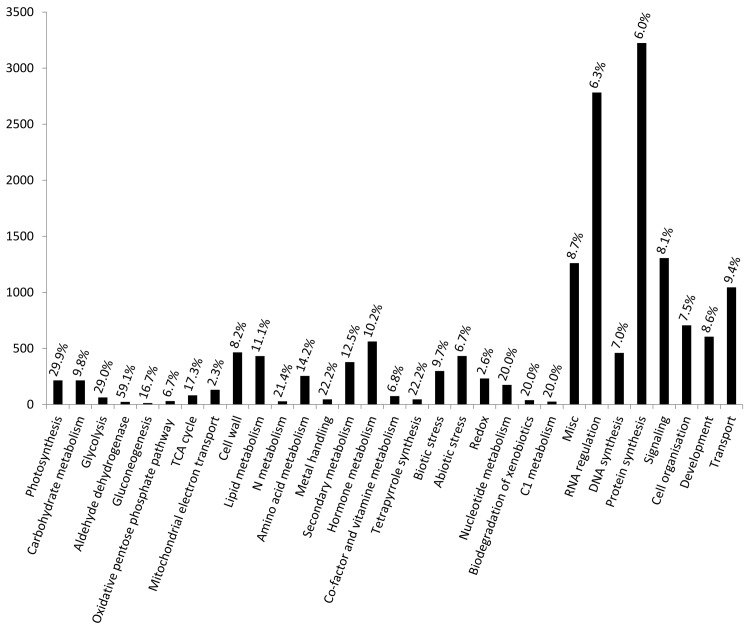
Fig 3. Categorization of expressed genes.
Classifications were performed using MapMan software (Ver. 3.5.1) based on Arabidopsis thaliana. Duplicate mapping genes were not included. p-values and false discovery rate (FDR) values were calculated using the GeneCycle package of R software. Temporally expressed genes with p-values of <0.05 (Fisher’s exact g test) and FDR values of <0.05. Duplicate mapping genes were not included; numbers on the graph indicate the genetic rates of temporal expression patterns in all genes of each category.

