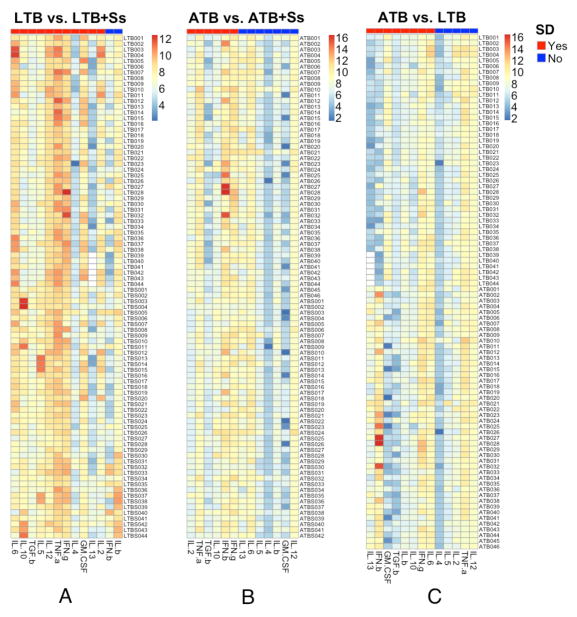
Figure 4. Heatmaps depicting the trends in the modulation of cytokines in Ss-TB coinfection and in LTB versus ATB.
Heatmaps of log2 transformed plasma levels for LTB vs. LTB+Ss, ATB vs. ATB+Ss, and ATB vs. LTB were shown in panel A, B, C respectively, in which each row stands for a sample and each column stands for a cytokine. The annotation bar indicates if there is a significant difference (SD) between two groups or not for each cytokine. The p value of each cytokine was calculated by Student’s t-test and adjusted by Benjamini-Hochberg Procedure.

