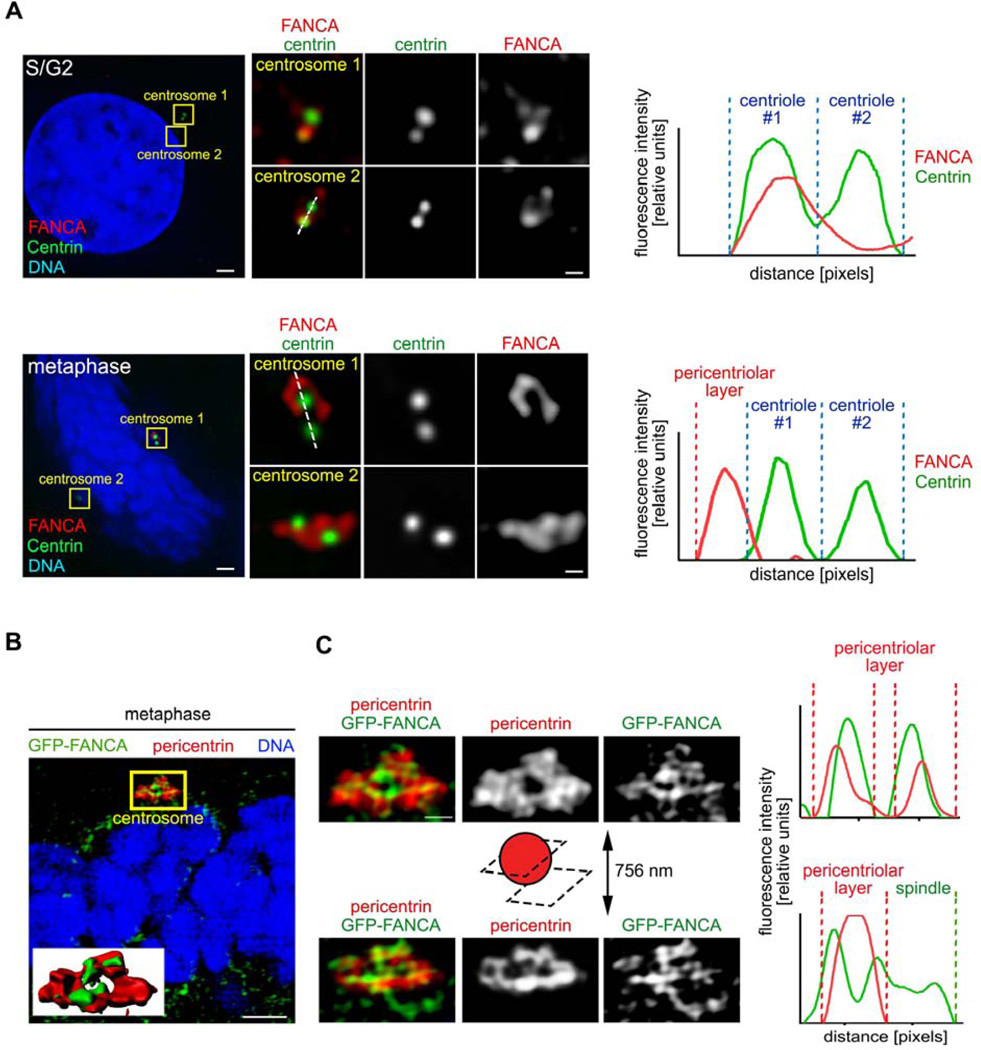
Figure 5. FANCA shuttles to the pericentriolar material during mitosis.
(A) HeLa cells were immunostained with antibodies against endogenous FANCA (red) and centrin (green), imaged with deconvolution microscopy (Applied Precision personalDx) and deconvolved with Softworx imaging suite (10 iterations, ratio: conservative). Fluorescence intensity profiles demonstrate that FANCA colocalizes with centrin in interphase and migrates away from centrioles at metaphase. Scale bars: 1.5 µm (left) and 300 nm (right) (B) Representative super-resolution image of human fibroblast stably expressing GFP-FANCA and stained with antibody against the pericentriolar material marker (pericentrin). Inserted 3D rendering of the centrosome shows colocalization of GFP-FANCA and pericentrin. Scale bars: 2 µm. The yellow region of interest is magnified (C) to show FANCA fibers embedded within the PCM (centrosome cross-section) and extending towards the spindle (centrosome outer layer section). Fluorescence intensity profiles (right) of GFP-FANCA/pericentrin signal at PCM and spindle are shown on the right. Scale bar: 500 nm. SR-SIM images were acquired on Zeiss ELYRA PS.1 super-resolution microscopy system and exported using Imaris imaging suite.

