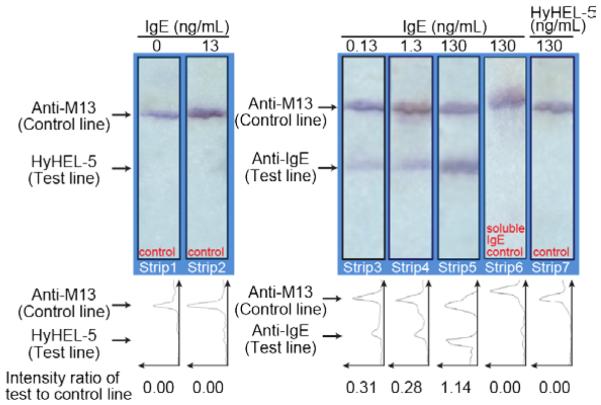
Figure 6.
Control for non-specific binding of IgE and aptamer-phage to an unrelated protein (the murine anti-lysozyme IgG antibody HyHEL-5). Strips 1 & 2; HyHEL-5 was spotted on the test line and anti-M13 antibodies on the control line. IgE protein (100 μL in LFA buffer) was passed through the membrane and aptamer-phage were added as reporters. No signal was observed on the HyHEL-5 test line. Strips 3, 4 & 5; To confirm specificity and sensitivity of the assay, varied concentrations of IgE were passed through the membrane. Strip 6; Competition assay where free IgE aptamer was passed on the strip prior to offering the aptamer-phage construct; 130 ng/mL IgE in 100 μL of LFA buffer were passed, followed by soluble IgE aptamer (10 μM aptamer in 100 μL of LFA buffer) and then the aptamer-phage construct was offered. No signal was observed on the test line confirming that soluble anti-IgE aptamer competes with aptamer-phage for the available binding sites on the IgE protein. Strip 7; 100 μL of HyHEL-5 in LFA buffer was passed through the membrane with anti-IgE and anti-M13 lines and detected using the IgE aptamer-phage reporter. No signal was observed on the HyHEL-5 test line, confirming specificity of the assay. Line intensity profiles as evaluated by ImageJ density analysis of the LFA strips. The area under each peak was numerically integrated using the ImageJ Gel Analysis Toolbox to give the intensity for that line. The intensity of the test line divided by the intensity of the control line for each strip is shown below each line intensity profile.

