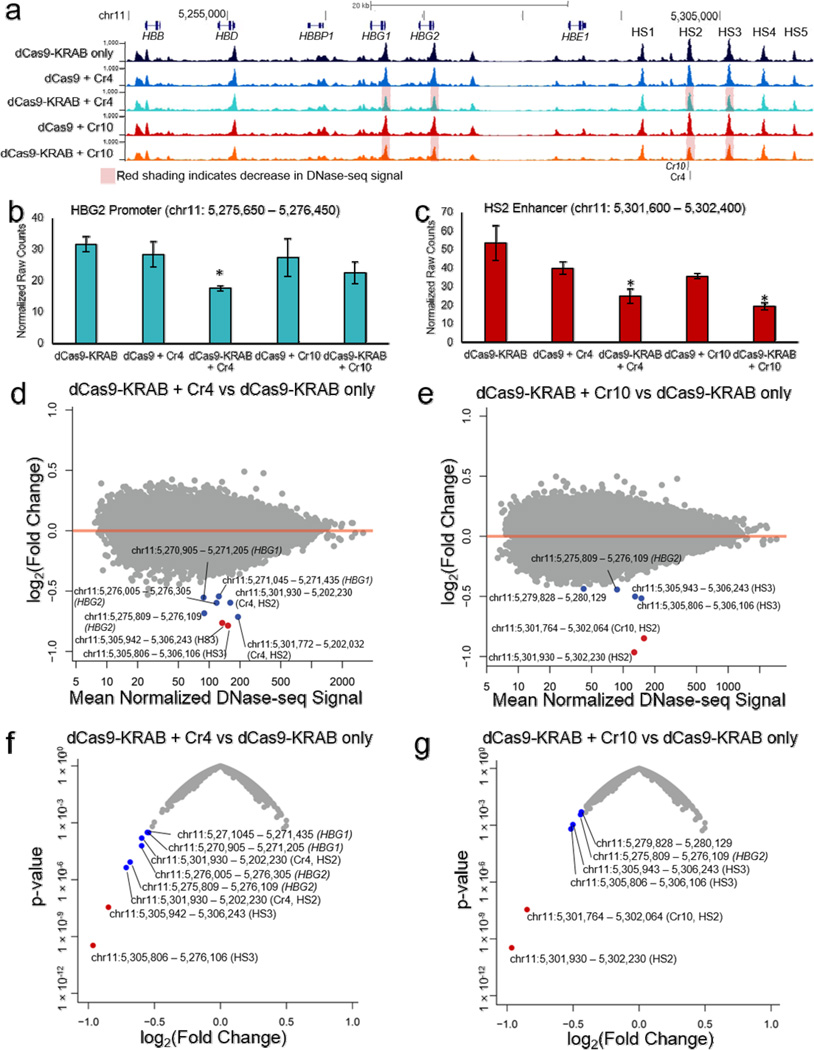
Figure 5. Changes in global chromatin landscape with dCas9-KRAB localized to the HS2 distal enhancer.
(a) Genome browser tracks of DNase-seq alignments at the globin locus (chr11: 5244651 – 5314450) show reduced DHS peaks at the HS2 and HS3 enhancers, as well as HBG1 and HBG2 promoter regions, in conditions containing dCas9-KRAB with sgRNA compared to dCas9-KRAB without sgRNA. Red shading labels the HBG1 promoter, HBG2 promoter, HS2 enhancer and HS3 enhancer regions for dCas9-KRAB + Cr4/10, which demonstrated decreased chromatin accessibility when compared to dCas9-KRAB with no sgRNA or dCas9 + Cr4/10. (b,c) Normalized DNase-seq cut counts within 800 bp window surrounding the (b) HBG2 promoter and (c) HS2 enhancer are shown (mean ± s.e.m, n = 3 biological replicates. * indicates p <0.05 compared to the dCas9-KRAB only sample (Student’s t-test). (d,e) Differential genome-wide analysis of changes in chromatin accessibility induced by dCas9-KRAB targeted by (d) Cr4 and (e) Cr10 compared to dCas9-KRAB without sgRNA in K562 cells. (f,g) Volcano plots of significance (p-value) versus fold-change for differential DESeq expression analysis of dCas9-KRAB guided by (f) Cr4 or (g) Cr10 compared to dCas9-KRAB without sgRNAs. Points labeled red indicate FDR < 0.05 by DESeq analysis. Points labeled in blue indicate other regions in the globin promoters or globin LCR.

