
Figure 4. Cancer cell and macrophage interactions with tissue microarrays.
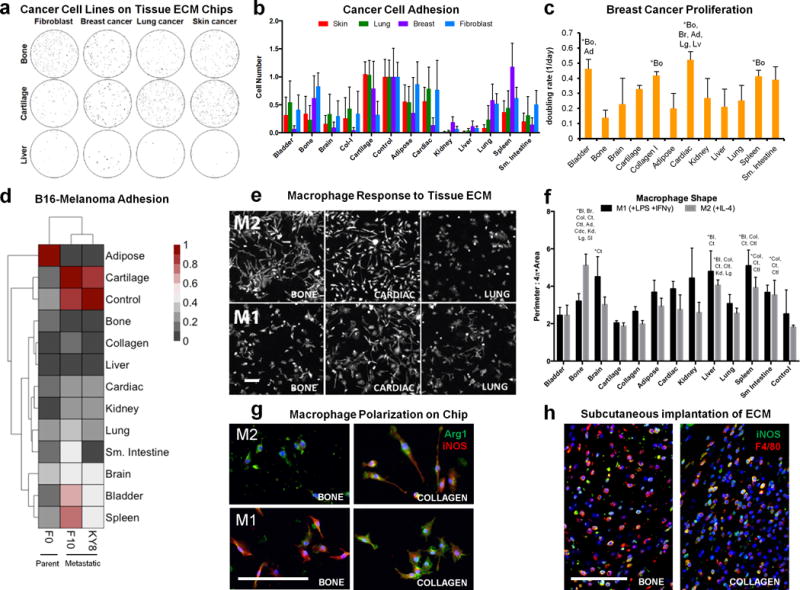
(a) Adhesion of three different human cancer cell lines and a control murine fibroblast line to different tissue ECM types was assessed on tissue microarrays. Cells (black) were stained with calcein-AM and counted with ImageJ software (representative of n=6 array spots). (b) Cell number was counted and normalized to the average number of cells on soluble collagen control spots located on the same microarray. Data are mean±s.d. (n=6 array spots). (c) Breast cancer cell doubling rate was calculated from cell number after 1, 2, and 7 days of culture on each tissue microarray spot. Data are mean±s.d. (n=3 array spots). (d) Heat map representation and hierarchial clustering of normalized (0–1) B16 murine melanoma cell adhesion between F0 (parent) and the metastatic KY8 (liver) and F10 (lung) cell lines seeded on the tissue array (n=6 tissue array spots and n=4 soluble collagen control spots). (e–f) The immunological properties of different tissue array spots were screened by seeding murine bone marrow-derived macrophages that were chemically polarized toward M1 or M2 phenotypes on tissue arrays. (e) Cell morphology was visualized after 24 hours with actin phalloidin staining (n=3 array spots, scale bar=200 μm). (f) Cell morphology was quantified as the convex hull area ratio. Data are mean±s.d. (n=3 array spots). (g) Macrophage phenotype on bone and collagen array spots after 24 hours in polarizing conditions was determined by immunofluorescence staining for Arginase-1 (green) and iNOS (red) (representative of n=3 array spots, scale bar=100 μm). (h) Bone tissue ECM and collagen were hydrated and injected subcutaneously into wild type C57BL/6 mice. Implants were harvested after one week for immunofluorescence staining for iNOS (green) and F4/80 (red) (representative of 4 images from n=2 animals). Scale bars=100 μm. The effect of array spot tissue type was analyzed by one-way ANOVA with a post-hoc Tukey test. Statistically significant increases (P<0.05) are signified with (*) and the abbreviations of the tissues they are greater than: Bl=bladder, Bo=bone, Br=brain, Ct=Cartilage, Col=purified collagen I particles, Ad= adipose Cdc=cardiac, Kd=kidney, Lv=liver, Lg=lung, Sp=spleen, SI=small intestine, Ctl=control soluble collagen only, or All=different from all other tissues. Statistical comparisons of cancer cell adhesion on different tissue spots are provided in Supplementary Table 1.