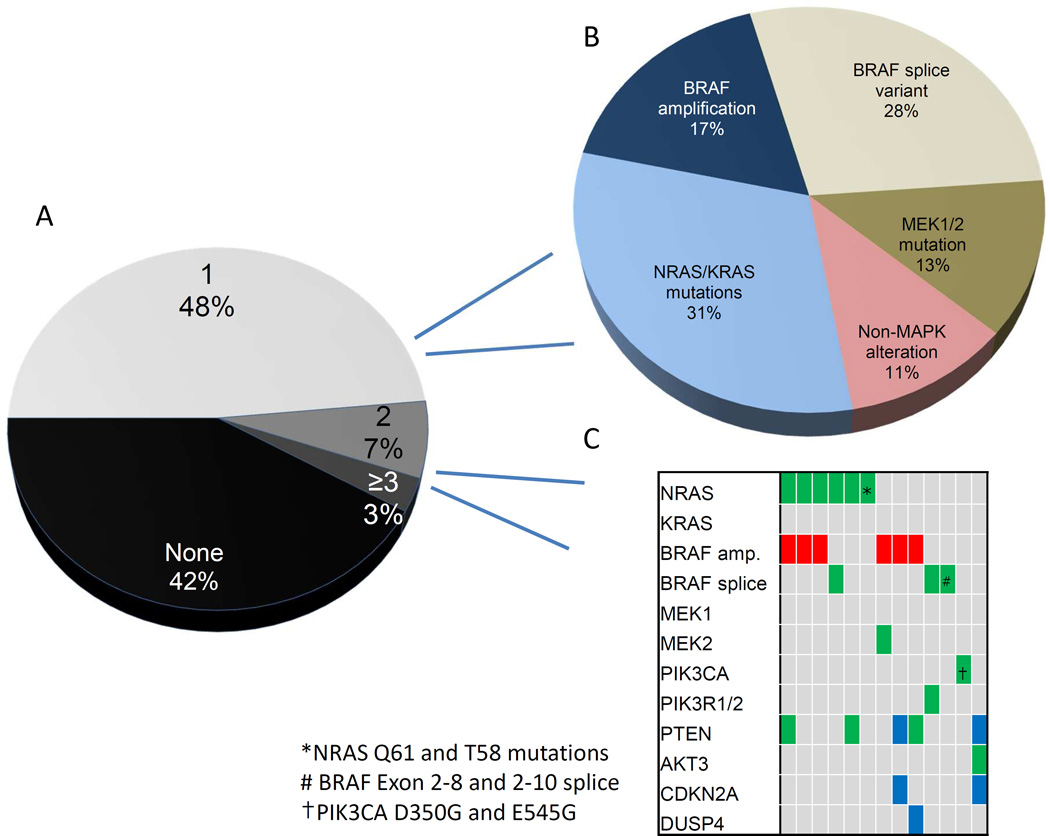
Figure 1.
(A) Number of identified resistance mechanisms per progression sample (B) Spectrum of resistance mechanisms in samples with only one identified alteration (C) Spectrum of resistance mechanisms in samples with >1 identified alteration co-occurring in the same sample
Legend: Green: mutation; Red: amplification; Blue: deletion; ^Distinct NRAS mutations identified in different samples

