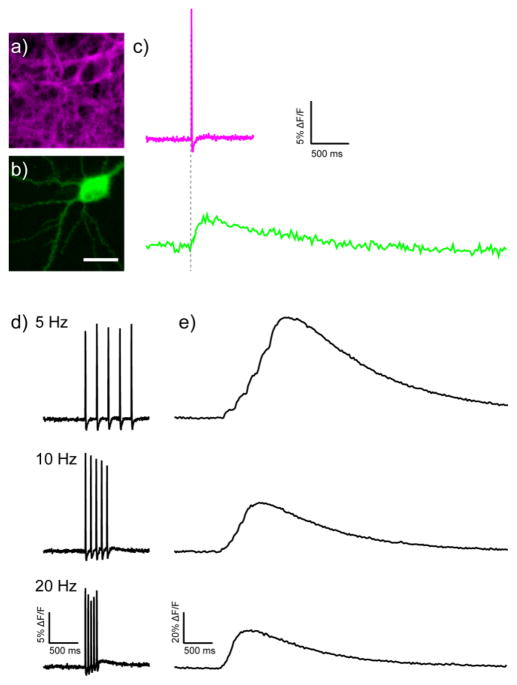
Figure 5.
Dual voltage and Ca2+ imaging with BeRST 1 and GCaMP6s. Epifluorescence images of a rat hippocampal neuron stained a) with BeRST 1 and expressing b) GCaMP6s. Scale bar is 20 μm. c) Sequential Ca2+ and voltage imaging during field stimulation of the neuron in panels a and b. Voltage- (upper) and Ca2+- (lower) induced changes in fluorescence. d) Voltage- (left) and e) Ca2+- (right) induced fluorescence response to trains of action potentials at the indicated frequency. Optical sample rate is 500 Hz for BeRST 1 and 40 Hz for GCaMP6s.

