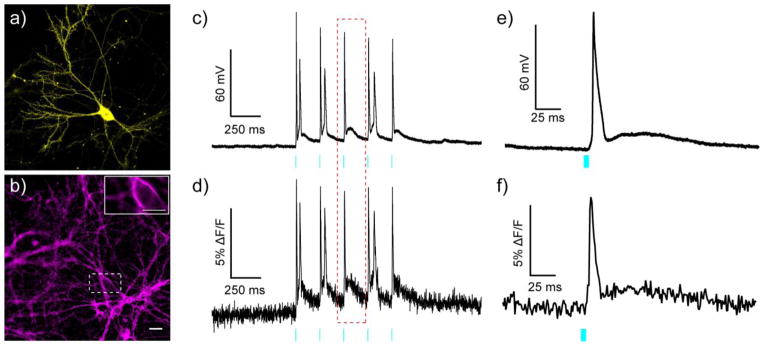
Figure 7.
All optical electrophysiology with BeRST 1 and ChR2. Epifluorescence images of rat hippocampal neurons expressing a) YFP-ChR2 and b) stained with BeRST 1. Inset on panel b is the region inscribed by the dotted white box. The inset image is single frame used to acquire data for panels d and f. Scale bars are 20 μm (panel a/b) and 10 μm (panel b, inset). Simultaneous c) electrophysiological and d) optical recording of membrane potential changes evoked by optogenetic stimulation of the neuron expressing YFP-ChR2 and stained with BeRST 1. Cyan light (475 nm LED, 80 mW/cm2) was provided in 5 ms pulses at a rate of 5 Hz. Magnified view of e) electrophysiological and f) optical recording of the action potential highlighted in the red, dotted box from panels c and d. Optical sampling rate was 1 kHz.

