Figure 8.
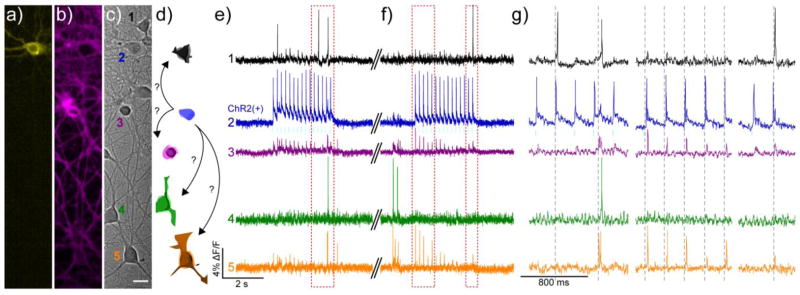
Using BeRST 1 and ChR2 to perturb network activity. Cultured rat hippocampal c) neurons transfected with a) YFP-ChR2 and stained with b) BeRST 1 were stimulated with 475 nm light (80 mW/cm2, 5 ms, 5 Hz, cyan bars) during two separate 3 second periods to evoke activity in the YFP-ChR2-expressing cell. Scale bar is 20 μm. d) Schematic representation of neurons from DIC image in panel c), color-coded to match the corresponding traces in e–g). The blue ChR2(+) cell is depicted making possible connections to other neurons in the field of view. Optical records of BeRST 1 responses were acquired at 500 Hz with an sCMOS camera during e) an optical recording session and f) subsequent trial, separated by approximately 30 seconds (double hash). Numbers and colors of traces refer to specific neurons in panels a–d. Red boxes indicate areas of the trace that have been magnified for clarity in panel g). Dotted grey lines are provided in panel g) to help visually estimate the spike timing of BeRST 1-stained neurons.

