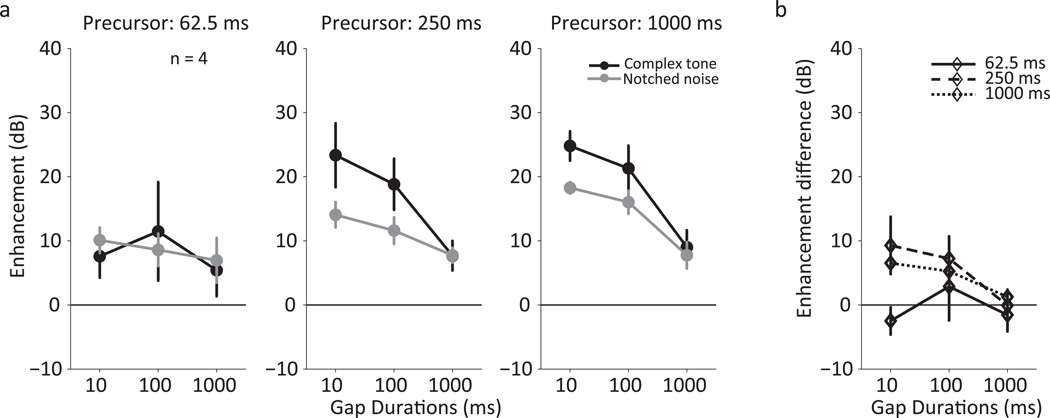
Figure 5.
Time courses of the mean enhancement of four listeners for two precursor types (inharmonic complex and notched noise). a, In each panel, the enhancement is plotted as a function of gap duration for one precursor duration, defined as the difference between the thresholds measured with and without the precursor. Different colors represent the notched-noise precursor and complex-tone precursor separately. b, The enhancement difference between the complex-tone precursor and the notched-noise precursor in each conditions. Different symbols represent different precursor durations. Error bars represent ±1 standard error of the mean.

