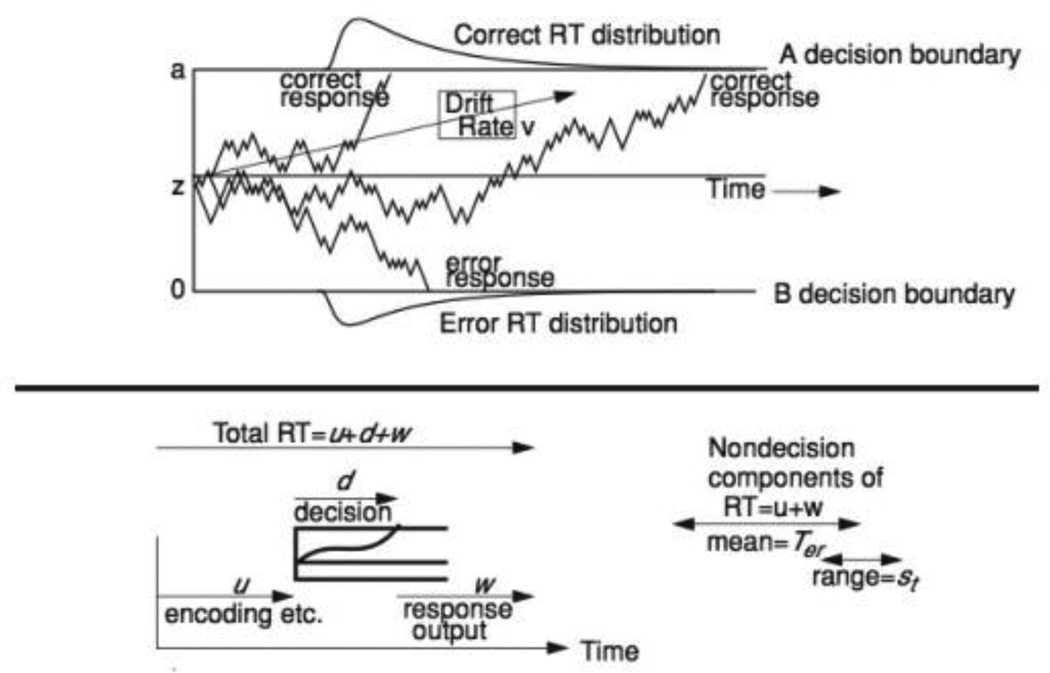
Figure 1.
The figure shows a representation of the diffusion model. The top panel represents simulated paths with drift rate v, boundary separation a, and starting point z. The bottom panel represents the three components of a response time: Encoding time (u), decision time (d), and response output (w) time. The non-decision component is the sum of u and w with mean = Ter and with variability represented by a uniform distribution with range st.

