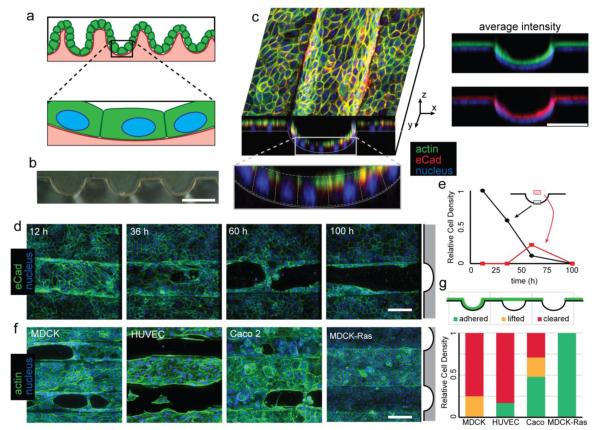
Figure 1.
Epithelial tissues clear from large-scale curvature. (A) Epithelial sheets having large-scale curvature can be nearly flat on the length scale of a single cell. (B) Cross-section of a PDMS substrate. (C) XY and XZ cross-sectional view of a confluent monolayer of MDCK on a curved PDMS substrate taken 12 h after seeding of cells. Average intensity of actin (green) and eCad (red) staining relative to cell nuclei (blue). (D) Time course showing cells clearing selectively from channels. Channel location indicated by gray schematic (right) (E) Quantitation of fluorescence from the indicated region showing lifting of tissues coincident with clearing. (F) 48 h fluorescence micrographs of MDCK, HUVEC, and Caco2, and Ras-transformed MDCK. (G) Quantitation of proportion adhered, lifted, and cleared tissue for each cell type. All scale bars: 100 μm.

