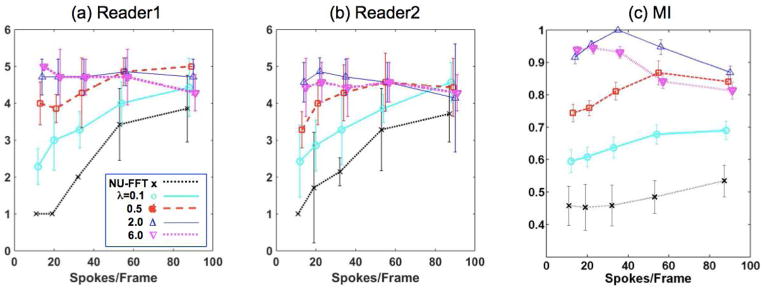
Figure 2.
Evaluation of spatial quality by two readers (a, b) and MI (c), one of six image similarity measures used in this study. MI shows trends similar to the other measures. See Supplemental Figure 1 for all the image similarity measures. MI values are normalized by their maximum value prior to calculating the mean and standard deviation. The error bars represents +/− 1 standard deviation.

