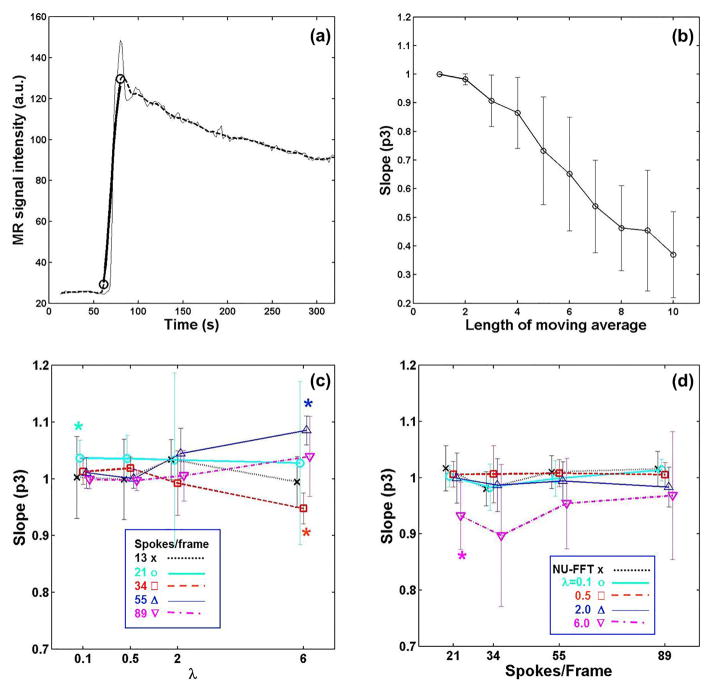
Figure 3.
Evaluation of temporal quality on the rising edge of the time-intensity curve from the aorta. (a) Example fit: the thin black line is a time intensity curve from the aorta; the dashed line is a filtered curve using a moving-average of 10 points; the thick line is the modified original curve fitted to the filtered one. (b) Time scaling parameter, p3, measured using the aorta time-intensity curves from 18 subjects decreases monotonically as the length of moving average increases. (c) Effect of regularization factor with respect to the time-intensity curve from NUFFT images. (d) Effect of temporal resolution with respect to the time-intensity curve with 13 spokes/frame. An asterisk indicates that the mean is significantly different from 1 (p < 0.05, t-test). The error bars represents +/− 1 standard deviation.

