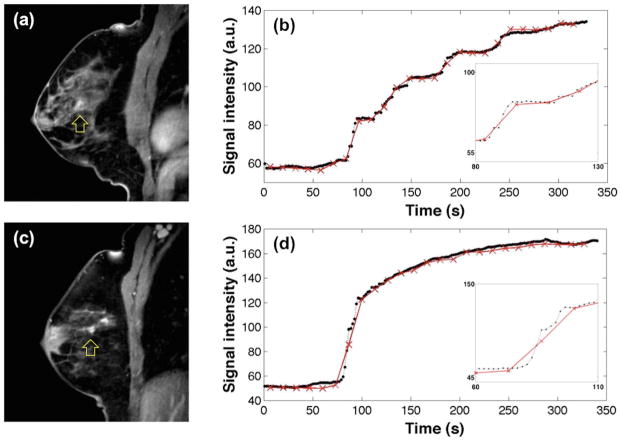
Figure 5.
Comparison of time-intensity curves from a slowly enhancing lesion (a and b) and a fast enhancing lesion (c and d), which were proven to be a fibrocystic change and an invasive ductal carcinoma, respectively. The images in (a) and (c) were reconstructed with the last 13 spokes with λ = 2. In (b) and (d), black dots with dashed lines are the time-intensity curves for images reconstructed using 13 spokes/frame with λ = 2, whereas red crosses with solid lines are for 89 spokes/frame with λ = 2.

