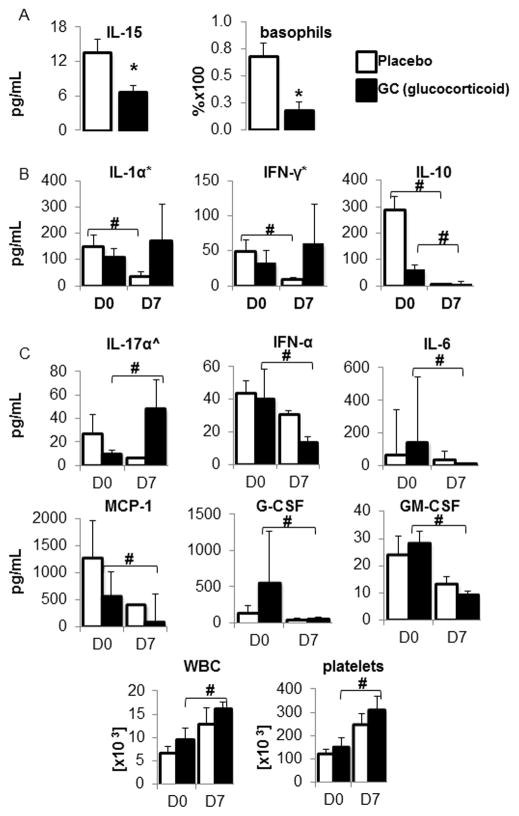
Figure 1. Comparisons of inflammatory meditators.
Figure 1A shows comparisons of cytokine levels and cell counts between the placebo and the glucocorticoid (GC) groups on days 0 and 7. Using an unpaired 2-tailed t-test with a p-value of <0.05 as our level of significance (*), the only alteration in cytokine levels was an elevated IL-15 concentration [pg/mL] in the placebo group on day 0 and a higher basophil count in the placebo group on day 7; (mean±SEM).
Figure 1B shows decreased IL-1α, IFN-γ and IL-10 levels in the placebo group on day 7 (D7), and decreased IL-10 levels in the GC group on day 7. Cytokine concentrations are depicted in pg/mL (mean±SEM). A p-value of <0.05 was considered significant (#).
Figure 1C shows elevated IL-17α levels and decreased IFN-α, IL-6, MCP-1, G-CSF and GM-CSF levels on day 7 (D7) in the glucocorticoid (GC) group. Cytokine concentrations are depicted in pg/mL (mean±SEM). IL-17α levels were analyzed using an unpaired t-test (indicated by ^). The rest of the cytokine levels were analyzed using a 2-tailed Mann-Whitney test based on a Fisher test and data are depicted as median±SE. A p-value of <0.05 was considered significant (#).

