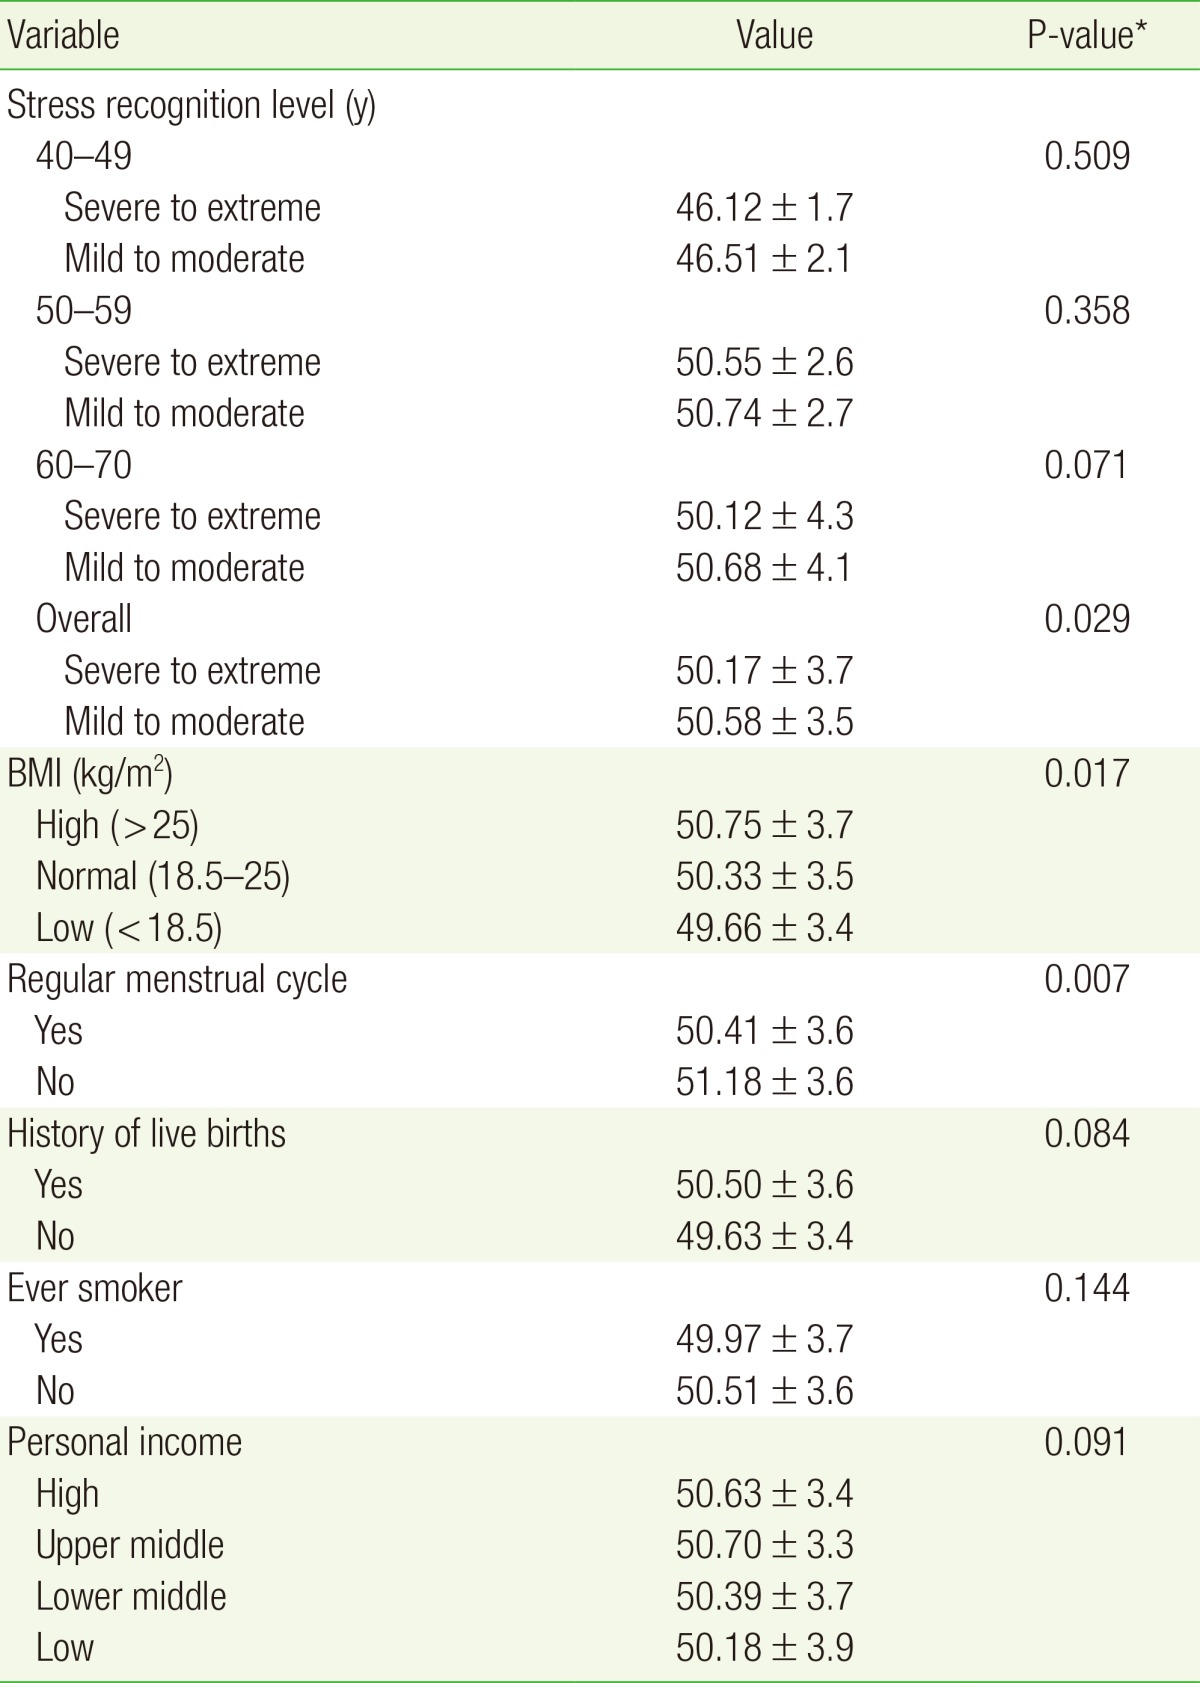
Table 2. Mean ANM according to stress, age, BMI, menstrual cycle regularity, history of live births, smoking, and personal income.

Values are presented as mean ANM±standard deviation.
ANM, age at natural menopause; BMI, body mass index.
*Obtained by one-way analysis of variance or Student t-test.
