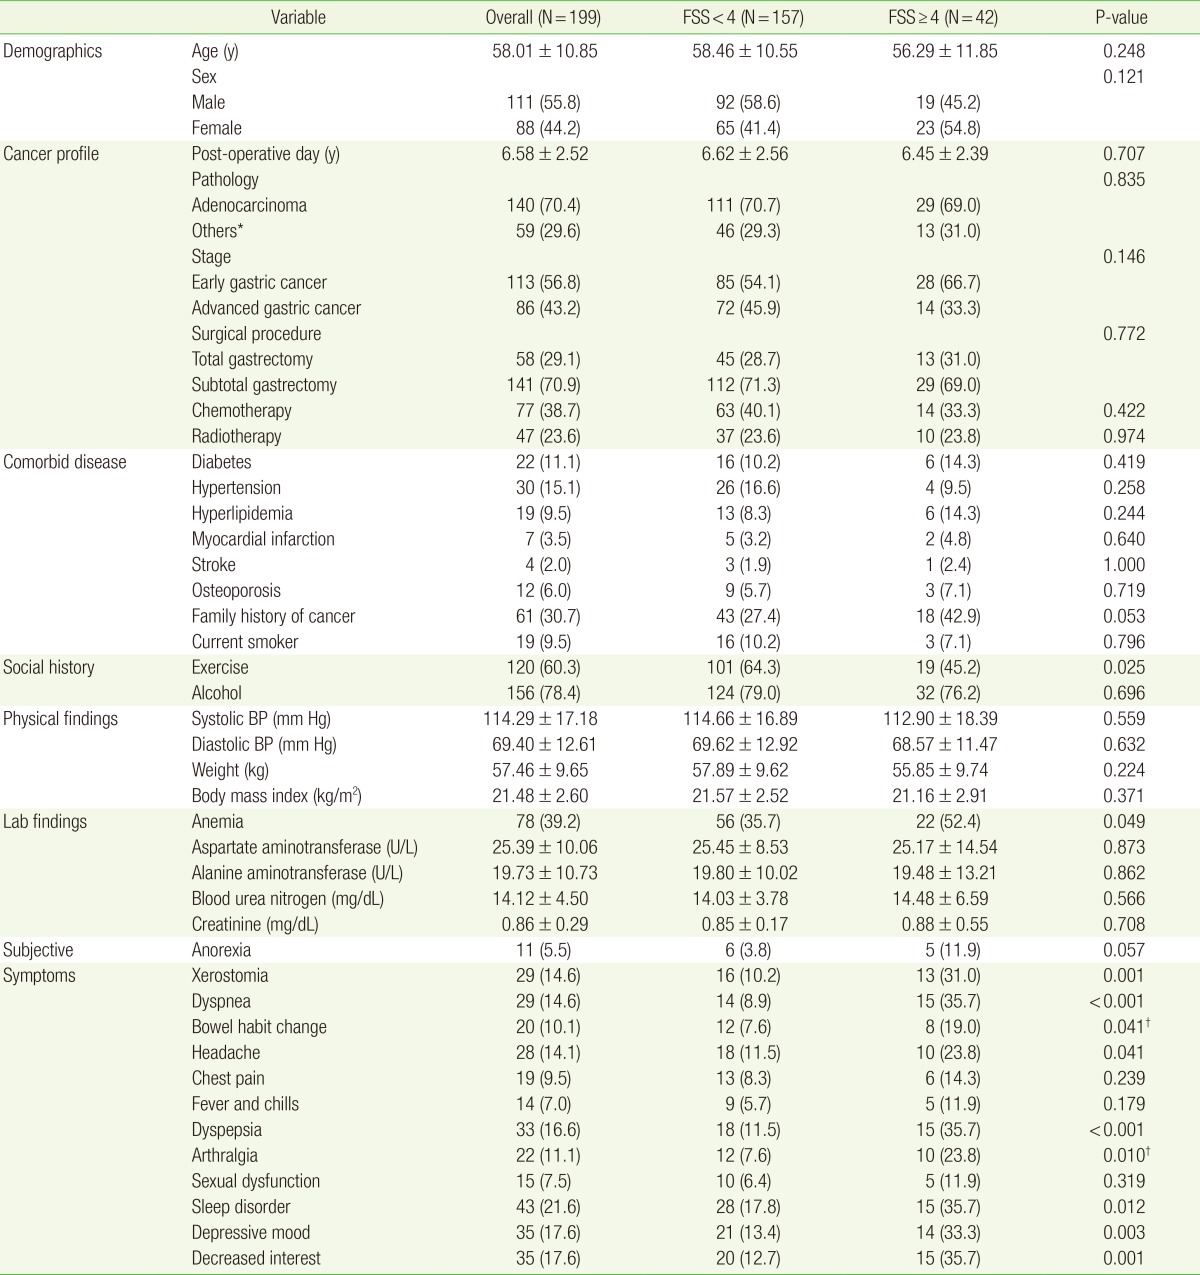
Table 1. Comparison of baseline characteristics by fatigue group (±one standard deviation).
Values are presented as mean±standard deviation or number (%).
FSS, fatigue severity scale; BP, blood pressure.
*Other subgroup of pathology was included signet ring cell carcinoma and lymphoepithelioma-like carcinoma. †Obtained by Student t-test and chi-square tests or Fisher's exact test between the fatigue and non-fatigue groups.

