
Fig. 2.
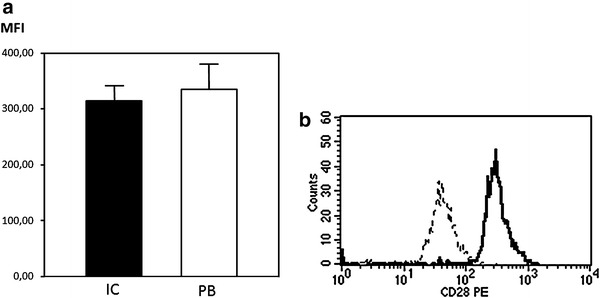
a Mean fluorescence intensity (MFI) of CD28 in CD4+CD28+ subpopulation in IC and PB samples. The MFI of CD28 in CD4+CD28+ subset was significantly lower in IC sample (p = 0.01, Wilcoxon signed rank test). b Representative flow cytometry histogram showing CD28 expression in IC (plain line) and PB (dotted line) samples