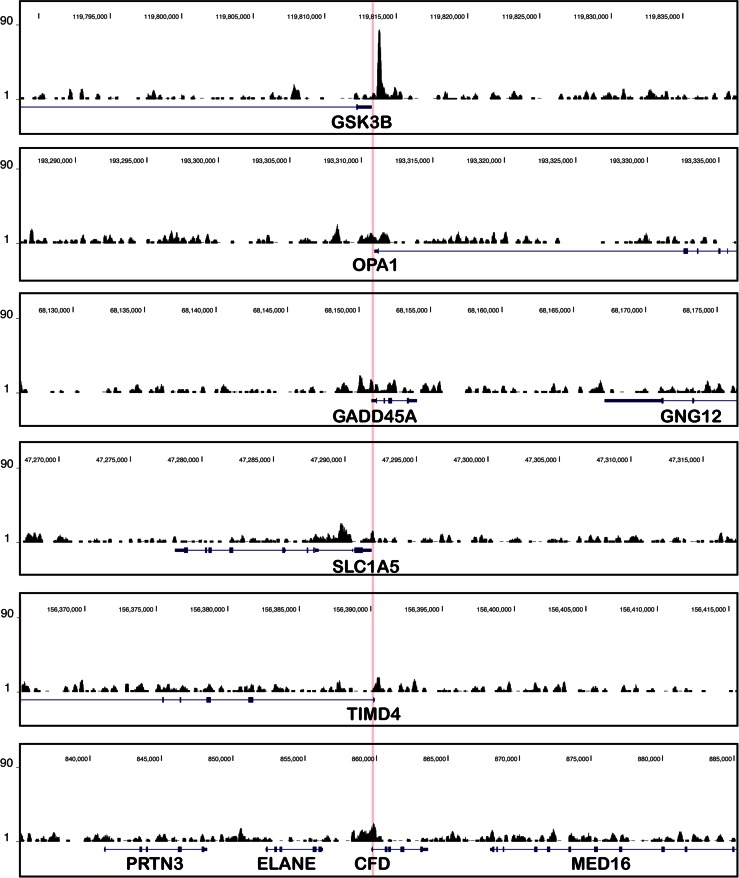
Fig. 2.
Published ChIP-seq profiles of H2B-S112GlcNAc in human cells. Published ChIP-seq profiles (Fujiki et al. 2011) at six genes for which the authors reported significant H2B-S112GlcNAc enrichment near their TSSs in HeLa cells. The profile at GSK3B was reported in Fig. 4e of Fujiki et al (2011); the five other genes were randomly chosen among the first 20 genes at the top of the list showing H2B-S112GlcNAc enrichment in Table S3A (Fujiki et al 2011). The ChIP-seq profiles are centered on each TSS (highlighted in pink) and extend 25 kb upstream and downstream (50 kb windows are shown in total), RefSeq genes are indicated with exons (boxes) and introns (thin lines), and genome coordinates are indicated above (version hg19). For all profiles, we used the same scale on the y-axis. Note that unlike the enrichment of H2B O-GlcNAcylation ChIP signal at GSK3B, the signals at the other positively scored genes are approaching background ChIP signals

