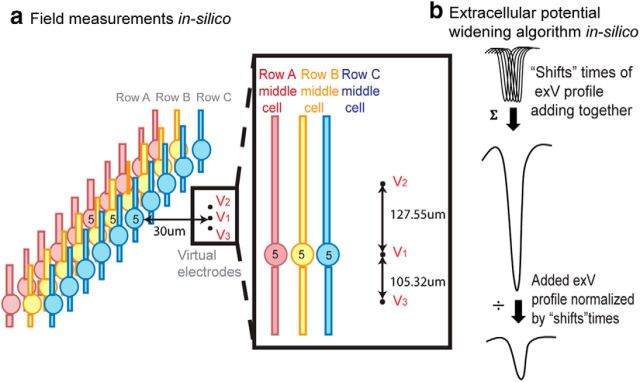
Figure 3.
Speed and field measurements in the simulated network. a, Transverse action potential propagation and network extracellular field measurement. Row A affects Row B, and both Rows A and B affect Row C through electrical field effect. Three virtual electrodes were placed 30 μm away from the third row middle cell the extracellular voltages resulting from all of the cells in Row A–C were measured at v1, v2, and v3. The field amplitude was calculated as the average of the spatial difference of v1 and v2 and the spatial difference of v1 and v3 (Eq. 3). b, When measuring the field amplitude, an extracellular potential widening algorithm (“shifting algorithm”) was applied for each cell's extracellular waveform to best represent experimental recording. Each recorded extracellular voltage waveform was widened by summing “shift” times of copies (each shifted by 1 time step) and normalized to preserve the amplitude of the measured extracellular voltage signal. Among 30 randomly selected spikes from in vitro Michigan shank recording, the mean spike width was 8.57 ± 5.36 ms. The extracellular voltage from a single cell was shifted in time Nshift times and added. The resulting waveform amplitude waveform was then divided by N. With Nshift = 20, the model generated first spike width of 7.65 ms that is consistent with experimental results. This value of Nshift was used for all simulations.

