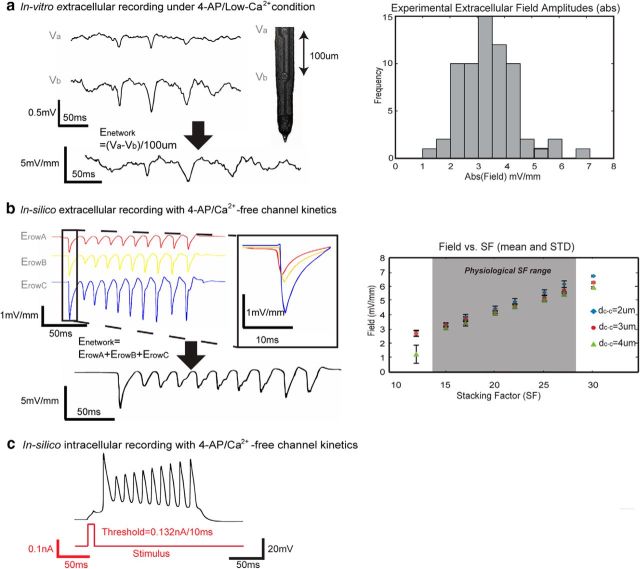
Figure 4.
Validation of the model through field amplitude and spiking characteristics. a, Left, Typical experimental recordings of extracellular potential from the somatic and dendritic layer obtained in vitro in the transverse hippocampal slice (Va and Vb, respectively); the electric field amplitude is calculated by taking the spatial derivative of the voltages. Right, A histogram of the electric field amplitude values recorded from 65 spikes from five unfolded hippocampus preparation showed that in vitro field amplitudes are between 2.5 and 5 mV/mm. b, Left, An example of simulated extracellular electric field of Row A–C layers in the model with SF = 20 and dc-c = 2.94 μm. Field amplitudes generated by Row A–C layers were 0.99, 1.14, and 2.45 mV/mm (Eq. 3), respectively, and the network electric field amplitude was 4.58 mV/mm as the sum of the field amplitude produced by the three layers (Eq. 4). Propagation of the activity between the layers is shown in the insert box. Right, For physiologically relevant values of SF, the network field amplitude ranged from 3.26 to 5.80 mV/mm (N = 180 where n = 10 trials with variance = 0.1 μm for each of the mean values of dc-c = 2, 3, and 4 μm and physiologic SF = 15, 17, 20, 22, 25, and 27; see Materials and Methods for physiologic SF range analysis), increasing with higher values of SF. c, Intracellular voltage recordings indicate that action potential had a threshold of 0.132 mA with a 10 ms pulse.

