Figure 1.
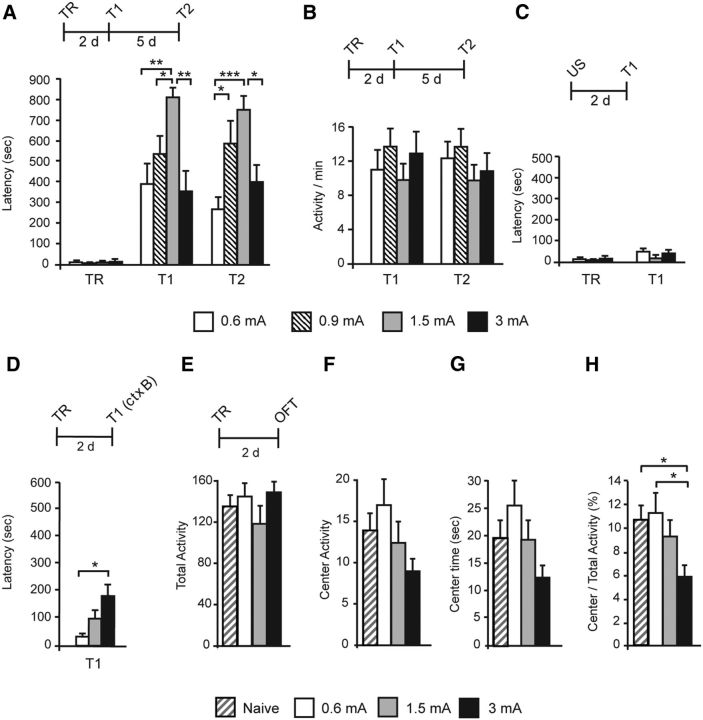
Inverted U function between IA memory retention and increasing footshock intensity; anxiety and context generalization. Experimental schedules are shown above each panel. A, Data are shown as mean ± SEM latency expressed in seconds. Latency was measured at 2 d (T1) and 7 d (T2) after TR that was elicited with a 0.6, 0.9, 1.5, or 3 mA footshock. B, Data are expressed as the number ± SEM of beam breaks per minute. Animals' activity was tested at 2 d (T1) and 7 d (T2) after training. C, Latency was tested 2 d after the presentation of the 0.6, 1.5, or 3 mA footshock as an US (T1) and compared with the latency of a different group at TR. D, Latency was measured in context B (ctx B) 2 d after TR. E–H, Open-field test (OFT) after TR and an RS. Data are expressed as the mean ± SEM of total activity, center activity, center time, and center/total activity. Total activity in the arena (E), activity in the center of the arena (F), time spent in the center of the arena (G), and ratio of center activity over total activity (H) were measured in naive and trained animals with a 0.6, 1.5, or 3 mA footshock 2 d after training. *p < 0.05, **p < 0.01, ***p < 0.001.

