Figure 7.
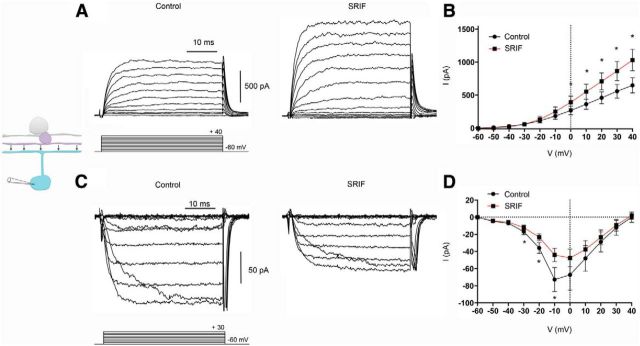
SRIF modulation of K+ and Ca2+ channel currents in M1 ipRGCs from OPN–EGFP retinas. A, Outward IK recording from an M1 ipRGC in a retinal slice in the absence (left) and presence (right) of SRIF (100 nm). B, Mean I–V relationships for IK from recordings in slices in the absence (black) and presence (red) of SRIF. C, ICa recording in an isolated EGFP cell in the absence (left) and presence (right) of SRIF. D, Mean I–V relationships for ICa pooled from slices and isolated cells in the absence (black) and presence (red) of SRIF. Recordings were made in the presence of TTX (500 nm). Voltage command protocol is shown below the current trace. n = 8–9 cells per group. *p < 0.05.

