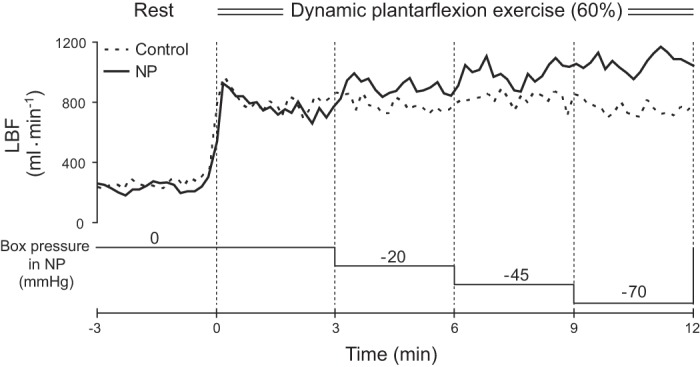
Fig. 1.

Leg blood flow (LBF) responses during exercise at 60% of peak workload in the control and negative pressure (NP) trials in a representative subject. Dashed lines indicate the exercise start time (i.e., 0 min) or the time box pressure changed in the NP trial. To better show the experimental protocol, changes in box pressure during the NP trial are shown schematically.
