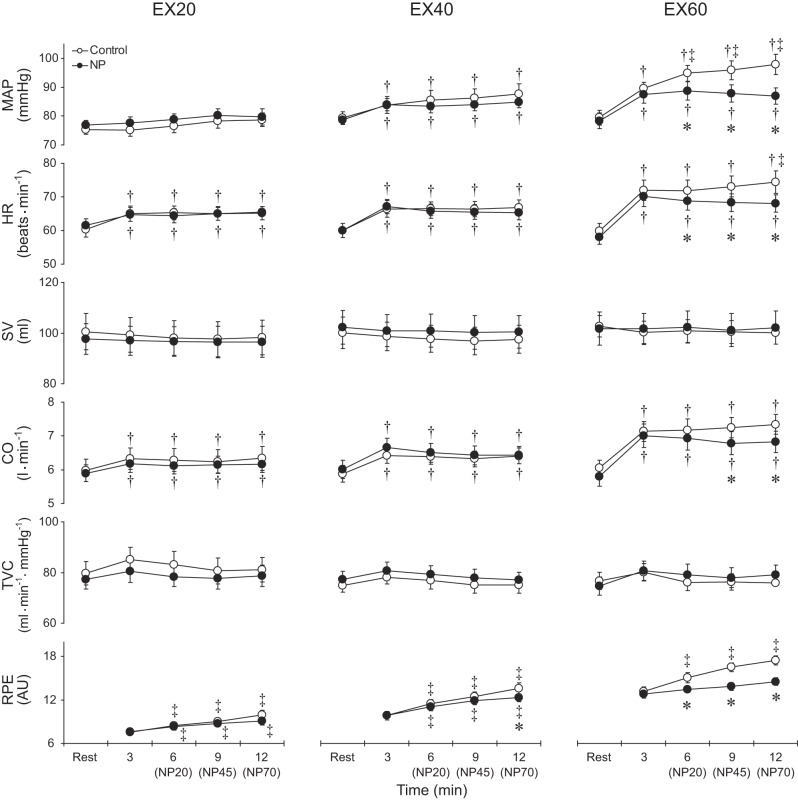
Fig. 3.
Group averaged mean arterial pressure (MAP), heart rate (HR), stroke volume (SV), cardiac output (CO), total vascular conductance (TVC) and ratings of perceived exertion (RPE) during exercise at 20%, 40%, and 60% of peak workload in the control and NP trials. AU, arbitrary unit. Other abbreviations are the same as in Fig. 2. *P < 0.05 vs. control; †P < 0.05 vs. rest; ‡P < 0.05 vs. 3rd min of exercise (i.e., when the box pressure is the same as the ambient pressure in both the control and NP trials).

