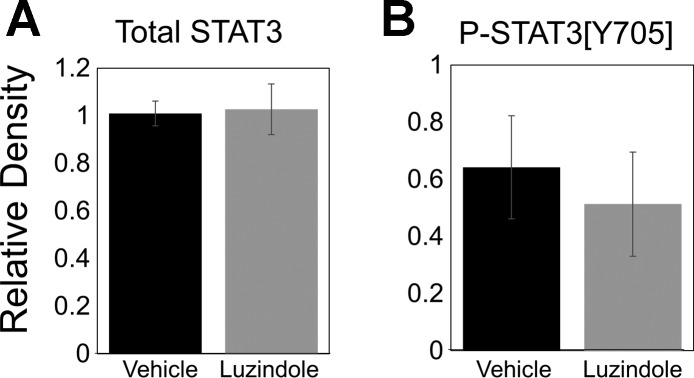
Fig. 4.
Expression of total signal transducers and activators of transcription 3 (STAT3) and phosphorylated STAT3 [Y705] in ground squirrel brain. There was no significant difference between groups in total STAT3 (A) or P-STAT3 [Y705] (B; n = 5 per group). The bar graphs represent quantification of Western blots. Error bars represent means ± SE.

