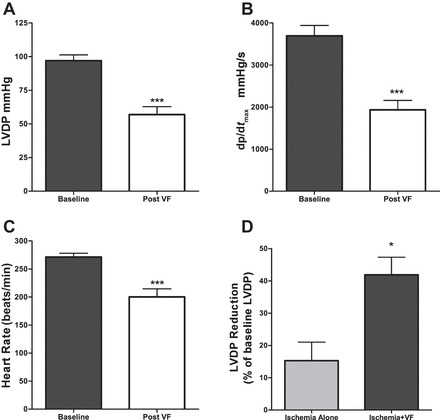
Fig. 1.

Post-ventricular fibrillation (VF) cardiac hemodynamics compared with baseline in nontreated controls. A: left ventricular developed pressure (LVDP) following 15 min ischemia and 1 min VF. B: left ventricle (LV) dp/dtmax following 15 min ischemia and 1 min VF. C: heart rate (HR) following 15 min ischemia and 1 min VF; n = 12 in each group. D: %reduction of LVDP compared with baseline following 15 min ischemia alone (n = 4) vs. following 15 min ischemia and a subsequent 1-min VF (n = 12). *P < 0.05 and ***P < 0.001.
