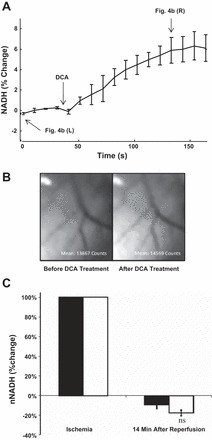
Fig. 4.

Effects of DCA on cardiac mitochondrial redox state. A: NADH fluorescence in normoxic hearts performed before and after DCA treatment; n = 4. P = 0.002 compared with before DCA treatment. B: representative NADH fluorescence images. Left, epicardial NADH fluorescence before DCA treatment, at time 0 in A. Right, epicardial NADH fluorescence after DCA addition, at the time indicated in A. C: %change in NADH fluorescence in the presence (n = 8) and absence (n = 5) of DCA. nNADH, normalized NADH. Open bars, Nontreated control; filled bars, DCA pretreated.
