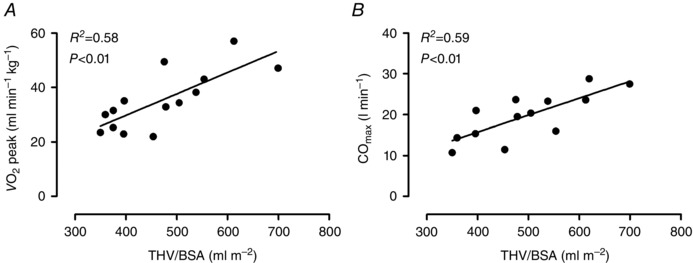
Figure 4. Total heart volumes versus peak oxygen uptake and maximal cardiac output .

A, the relationship between total heart volumes normalized for body surface area (THV/BSA) and peak oxygen uptake ( peak). B, the relationship between THV/BSA and maximal cardiac output (COmax) determined by the dye dilution technique. Only elderly subjects underwent invasive examinations and are included in the figures.
