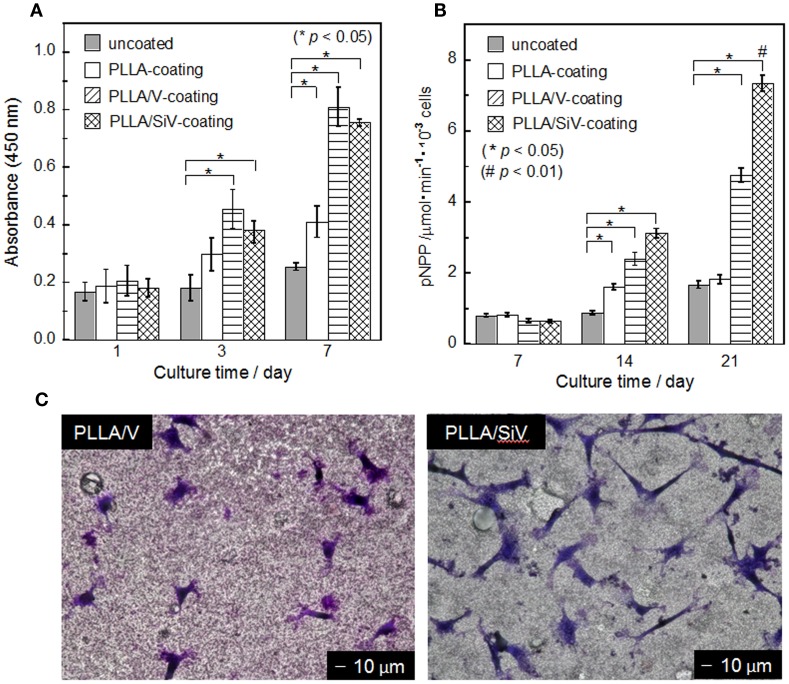
Figure 7.
(A) Cell number (mean ± SEM; *p < 0.05 as compared to uncoated by t-test), (B) ALP activity (mean ± SEM; *p < 0.05 as compared to uncoated by t-test, #p < 0.05 as compared to other three samples by Tukey’s multiple comparison test), and (C) morphology of MC3T3-E1 cells cultured on samples. (C) After 3 days of culturing. Reprinted with permission from Yamada et al. (2013).

