Figure 4.
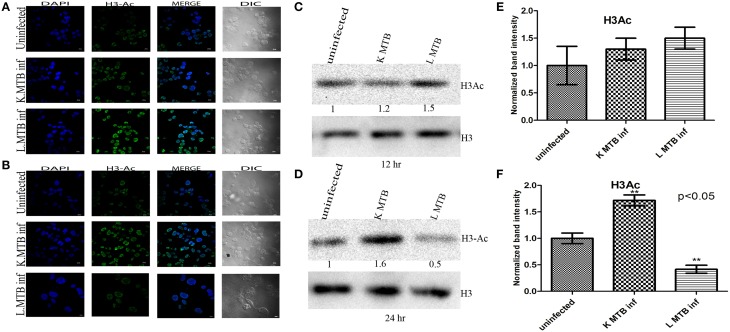
Histone H3 acetylation status in macrophages upon MTB infection. (A) Increase in histone H3-acetylation status in MTB-infected macrophages at 12 h PI is visualized by confocal microscopy; (B) decrease in histone H3-acetylation in MTB-infected macrophages at 24 h PI; (C,D) different levels of acetylated histone H3 at 12 h and 24 h PI by western blot. (E,F) Densitometric analysis of H3Ac bands normalized with histone H3. Quantitative data of HDAC1 protein is expressed as the mean of ratio of densitometries of HDAC1 to histone H3 bands ± SD for three independent experiments. **p < 0.05.

