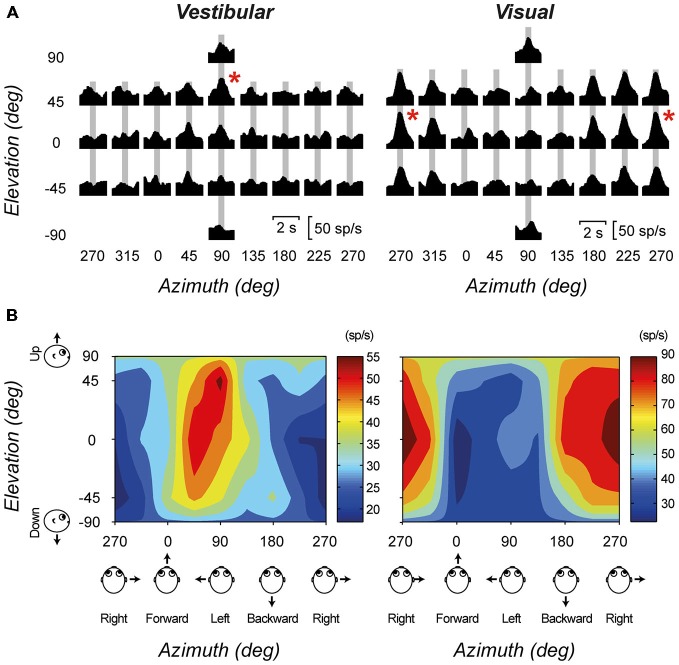
Figure 2.
An example cell with significant tuning during both the visual (optic flow) and vestibular stimulus conditions. (A) Response PSTHs for each of 26 directions during translation. Red asterisks mark the maximum response directions. The corresponding peak-times are marked by gray bars. (B) The corresponding color contour tuning (at peak time) for each stimulus condition. Figure modified from Meng and Angelaki (2010) with permission from the Journal of Neurophysiology.

