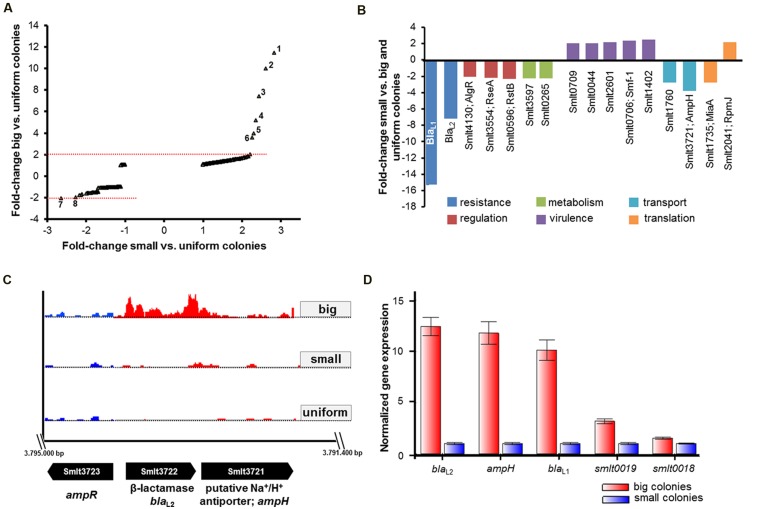
FIGURE 3.
RNA-seq and RT-qPCR data analysis for different SMK279a colony morphotypes. (A) Scatter plot of fold-change in transcription of genes among cells of big (Y-axis) and small (X-axis) colonies relative to untreated samples of uniform colonies grown in the absence of ampicillin on LB agar plates. A twofold change in the transcription of genes with adjusted P-value of ≤0.05 is considered as significantly, differentially regulated. Cells forming big colonies differentially regulated several genes mainly involved in degradation of antibiotics. The numbers in the plot indicate most strongly regulated genes: 1, smlt0018; 2, smlt2667; 3, smlt3772; 4, smlt2668; 5, smlt0019; 6, smlt3721; 7, smlt1760; and 7, smlt0596. (B) Differentially regulated genes in small colonies in comparison to big and uniform colonies. Down-regulation of blaL1 and blaL2 affected genes involved in regulation, metabolism, virulence, transport and genetic information processing/translation (for details see Table 6). (C) Transcriptome profiles of blaL2 and the flanking genes ampR (smlt3723) and ampH (smlt3721) among the colony morphotypes. The blaL2 gene was 6.9-fold and 7.4-fold down-regulated in cells forming small colonies in comparison to big and uniform colonies, respectively. Transcriptome profile images of the leading strand (indicated in red) and the lagging strand (indicated in blue) were generated with the IGB software (Nicol et al., 2009), merged and rearranged on the leading strand for a simplified visualization. (D) RT-qPCR analysis of genes, which were identified in the RNA-seq data set. Expression profiles of five different genes (blaL2; ampH; blaL1; smlt0019; smlt0018) were obtained from three independent experiments and analyzed based on the normalized gene expression [2-ΔΔC(t) method], using rpoD and 16S rRNA as internal reference genes.

