FIGURE 5.
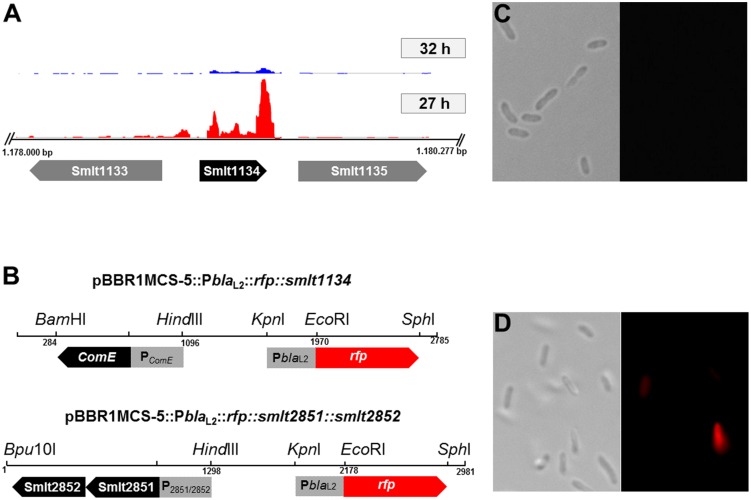
Expression of the comE homolog (smlt1134) under its native promoter. (A) Transcriptome profiles of smlt1134 (black arrow) and flanking genes smlt1133; smlt1135 (gray arrows) in an ‘ON’ state, 32 h (blue) and an ‘OFF’ state, 27 h (red). The comE homolog was found to be 5.4-fold down-regulated in the ‘ON’ state (32 h). Transcriptome profile images of the leading strand and the lagging strand [generated with the IGB software (Nicol et al., 2009)] were merged and rearranged on the leading strand for a simplified visualization. (B) Physical map and orientation of the comE homolog and both putative transporter genes in pBBR1MCS-5. The promoter regions were inserted upstream of PblaL2::rfp, resulting in pBBR1MCS-5::PblaL2::rfp::smlt1134; and pBBR1MCS-5::PblaL2::rfp::smlt2851::smlt2852. The recombinant plasmids were transferred to SMK279a cells and challenged with 100 μg/ml ampicillin. (C) Expression of the comE homolog in SMK279a under its native promoter PComE. Cells were cultivated for 7 h in LB medium supplemented with 100 μg/ml ampicillin. Expression of comE clearly affects blaL2 heterogeneous expression resulting in non-fluorescing cells (blaL2-OFF mode), here less than 1% of cells were in the bla-ON mode. Right and left panels are a bright-field and a fluorescence microscopic image, respectively. (D) Expression of both putative transporter genes (smlt2851; smlt2852) in SMK279a under their native promoter P2851/2852. Expression of the transporter genes did not alter phenotypic heterogeneous expression of the blaL2 gene. Here, 5.5 ± 2.12% of the cells were in the bla-ON and 94.5 ± 2.12% cells were in the bla-OFF mode. Cells were cultured under the same condition as indicated in (C). Right and left panels are a bright-field and a fluorescence microscopic image, respectively. Images (C) and (D) were recorded as described in Figure 4.

