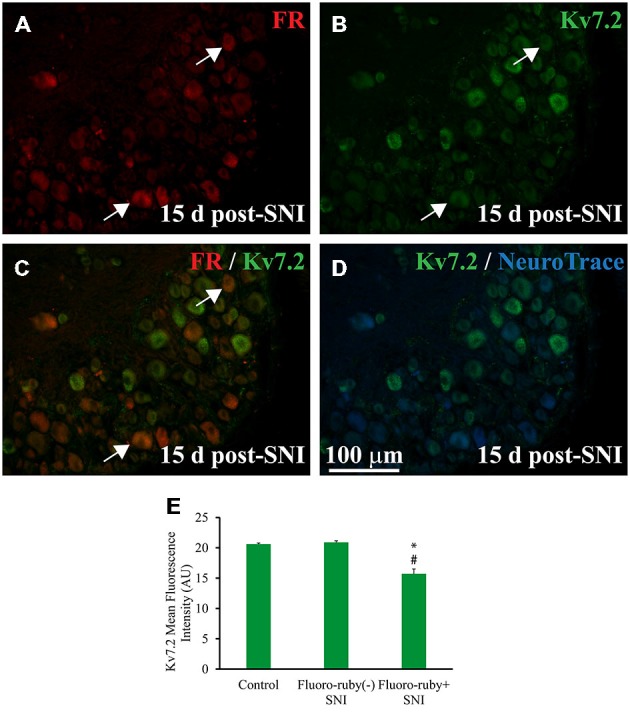
Figure 2.

Expression of Kv7.2 in Fluoro-ruby(+) DRG neurons 15 day post-surgery. (A) Shows a representative section from the DRG obtained from an animal in which axotomized fibers (SNI) were labeled with Fluoro-ruby. (B) Shows same slide stained for Kv7.2. (C) is a merge of (A,B) in which arrows indicate the few neurons co-localizing Kv7.2 and Fluoro-ruby. (D) Shows Kv7.2 counterstained with NeuroTrace. (E) Graph shows mean fluorescence intensity (MFI) for Kv7.2 in DRG neurons from control and SNI animals. Note that MFI was significantly lower in Fluoro-ruby(+) from SNI animals compared to neurons in control DRG (n = 3; t-test, *p = 0.003) or Fluoro-ruby(-) neurons in SNI DRG (n = 3; t-test, #p = 0.002). AU, arbitrary units. * or #p < 0.05.
