. 2015 Nov 25;68(6):547–555. doi: 10.4097/kjae.2015.68.6.547

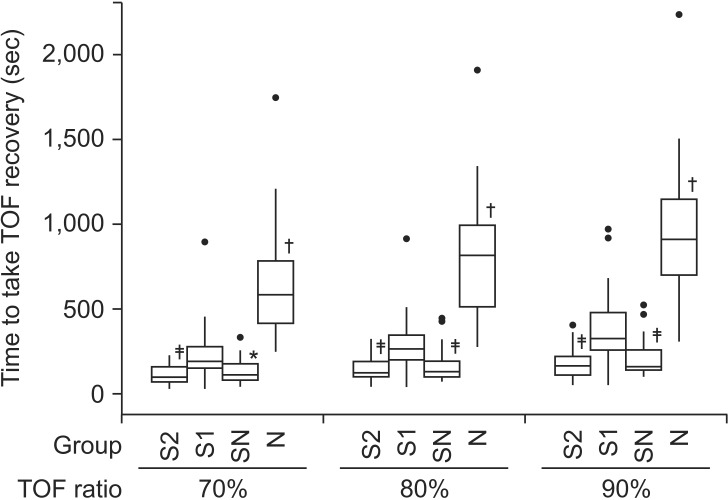
Fig. 2. The time to 70, 80 and 90% recovery of TOF ratio. Group N showed significantly longer time to 70, 80 and 90% recovery of TOF ratio than the other groups (P < 0.001). Group S2 and Group SN did not show significant difference in time to 70, 80 and 90% recovery of TOF ratio. The thick lines represent the median values, boxes indicate the interquartile range, whiskers represent the 10th and 90th percentiles, and block dots represent outliers. Group S2: sugammadex 2 mg/kg, Group S1: sugammadex 1 mg/kg, Group SN: sugammadex 1 mg/kg + neostigmine 50 µg/kg + glycopyrrolate 10 µg/kg, Group N: neostigmine 50 µg/kg + glycopyrrolate 10 µg/kg (*P < 0.05 when compared with group S1, P < 0.001 when compared with the other groups, P < 0.001 when compared with group S1).

Fig. 2