. 2015 Nov 25;68(6):547–555. doi: 10.4097/kjae.2015.68.6.547

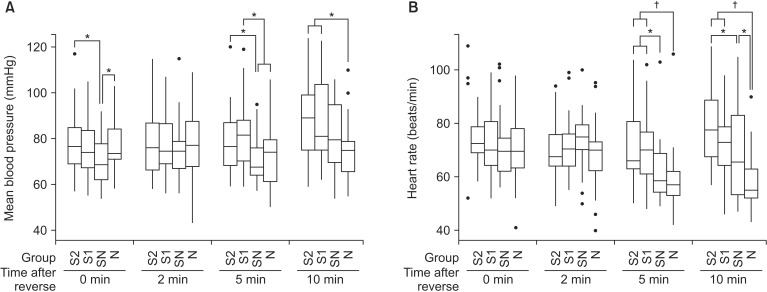
Fig. 3. The trend of the (A) mean blood pressure (MBP), and (B) heart rate (HR) after administration of neuromuscular reversal agents. (A) Immediately after the reversal agents administration, the MBP of group SN was significantly lower than group S2 and N (P < 0.05). After 5 min of the reversal agents administration, the MBP of the group SN and N were significantly lower than that of group S1 (P < 0.05), and the MBP of group SN was significantly lower than that of S2 (P < 0.05). After 10 min of the reversal agents administration, group N showed significantly lower MBP than group S2 and S1 (P < 0.05). (B) The HR of the group N were significantly lower than group S1 and S2 after 5 and 10 min of the reversal agents administration (P < 0.001). The group SN showed significantly lower HR than group S2 and S1 (P < 0.05) after 5 min, and significantly higher HR than group N (P < 0.05) and lower HR than group S2 (P < 0.05) after 10 min of the reversal agents administration. The thick lines represent the median values, boxes indicate the interquartile range, whiskers represent the 10th and 90th percentiles, and block dots represent outliers. Group S2: sugammadex 2 mg/kg, Group S1: sugammadex 1 mg/kg, Group SN: sugammadex 1 mg/kg + neostigmine 50 µg/kg + glycopyrrolate 10 µg/kg, Group N: neostigmine 50 µg/kg + glycopyrrolate 10 µg/kg (*P < 0.05, P < 0.001 when compared between groups).

Fig. 3