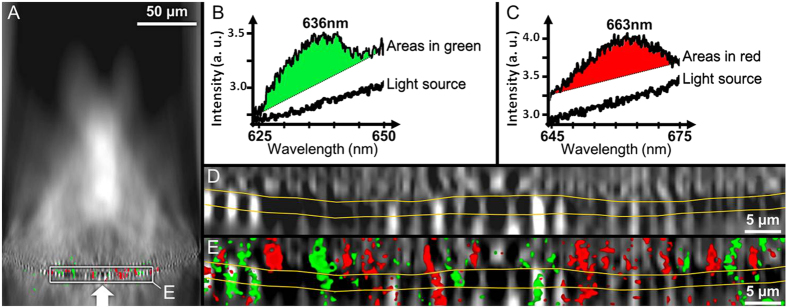
Figure 2.
Hyperspectral analysis of a single valve of Coscinodiscus centralis oriented with the foramen side upwards and the direction of the incident light indicated by a white arrow (A). The wavelength regions (green and red) where transmission spectra (B,C) differing from the light source are detected. Close view of the hyper-map in A (D). Close view of the composite image in A (E). The yellow lines in (D,E) indicate the transition between the foramen and cribrum layers of the valve, with the honeycombed structure in the middle.

