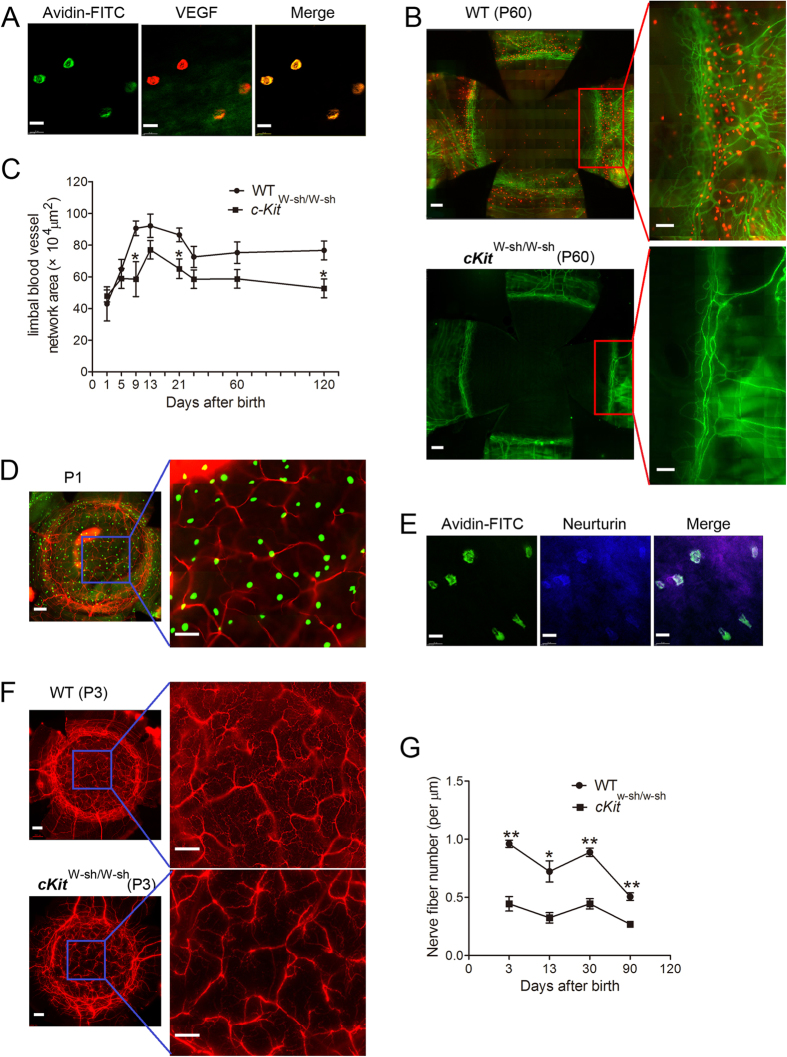
Figure 5. Corneal limbal blood vessel and corneal nerve fiber development in c-KitW-sh/W-sh and WT mice.
(A) The left image shows immunostaining of the limbus from a P3 mouse with avidin-FITC (green), the middle image shows staining with VEGF-PE (red), and the right image shows these two images merged, demonstrating MCs co-staining with VEGF. Scale bars: 20 μm. (B) These images depict immunostaining of corneas from P60 WT and c-KitW-sh/W-sh mutant mice with anti-CD31-FITC (green) and avidin-PE (red). The c-Kit-deficient mice (lower panel) had fewer MCs and a reduced distribution of limbal blood vessels compared to the WT mice (upper panel). Scale bars: left images, 200 μm; magnified right images, 100 μm. (C) This graph depicts the differences in limbal vessel development in c-KitW-sh/W-sh and WT mice. From P9 to P120, the limbal vascular network area in c-Kit-deficient mice was reduced compared to that in WT mice (n = 6 corneas per age group). *P < 0.05. (D) Immunostaining of a P1 mouse cornea with a complete limbus with tubulin (red, a nerve marker) and avidin-FITC (green) is depicted in these images. As shown, avidin-positive cells are distributed around nerve fibers. Scale bars: left image, 200 μm; right image, 100 μm. (E) These images show immunostaining with avidin-FITC (green) and neurturin-ALEXA FLUOR 350 (blue) of corneas from P3 mice. The merged image shows that some MCs contained neurturin. Scale bars: 20 μm. (F) Tubulin staining of a cornea with a complete limbus from a P3 WT mouse and cKit-deficient mouse is shown (top images: WT, bottom images: c-KitW-sh/W-sh). Nerve fiber density in c-KitW-sh/W-sh mice was reduced compared to WT mice. Scale bars: left images, 200 μm; right images, 100 μm. (G) The graph depicts the differences in nerve fiber density between WT and c-Kit-deficient mouse corneas. The nerve fiber density in c-KitW-sh/W-sh mouse corneas was significantly reduced compared to that in WT mice corneas at the four time points investigated (n = 6 corneas per age group). *P < 0.05, **P < 0.01.

