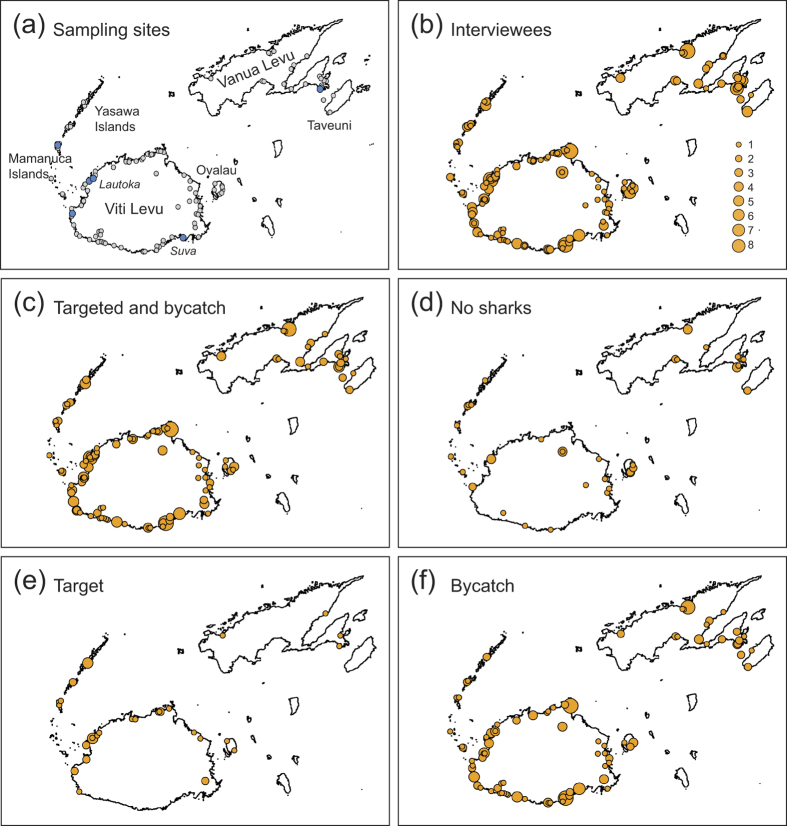
Figure 1. Interview sites and quantification of artisanal shark fisheries in Fiji.
(a) Sites where interviews were conducted (n = 117; grey dots) and samples taken for DNA barcoding (n = 6; blue dots); bubble plots of (b) the number of interviewees, (c) the number of interviewees that reported to catch sharks (targeted and bycatch), (d) the number of interviewees that reported to never catch sharks, (e) the number of interviewees that reported to target sharks, and (f) the number of interviewees that reported to catch sharks only as bycatch. The area of each dot (b–f) corresponds to the number of interviewees at this site (see (b) for scale of bubble sizes). Maps were generated using the map function of R on publicly available coastline coordinates obtained from the NOAA National Geophysical Data Center (http://www.ngdc.noaa.gov/mgg/shorelines/shorelines.html).

