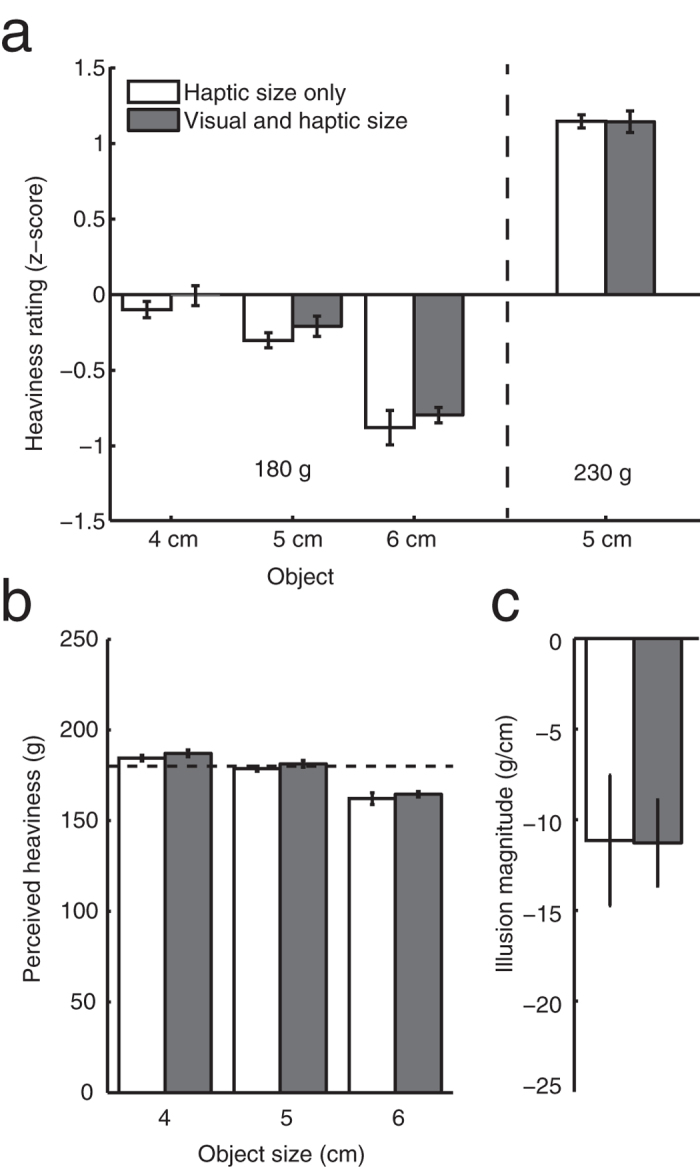
Figure 2. Results of Experiment 1, averaged over participants for the different object sizes in both conditions.

Error bars indicate the between subjects standard error. (a) The z-scores of the heaviness ratings. (b) The perceived heaviness (heaviness ratings converted into units of grams). The dashed line indicates the mass of the objects. (c) The magnitude of the illusion (the slope of a linear fit to the perceived heaviness as a function of objects size for the 180 g objects). The fit was performed on the individual participants’ data. Error bars indicate the standard error.
